
Z Scores and Quantiles
Loading the math board and drawing, please wait…
In collections
Probability & Statistics
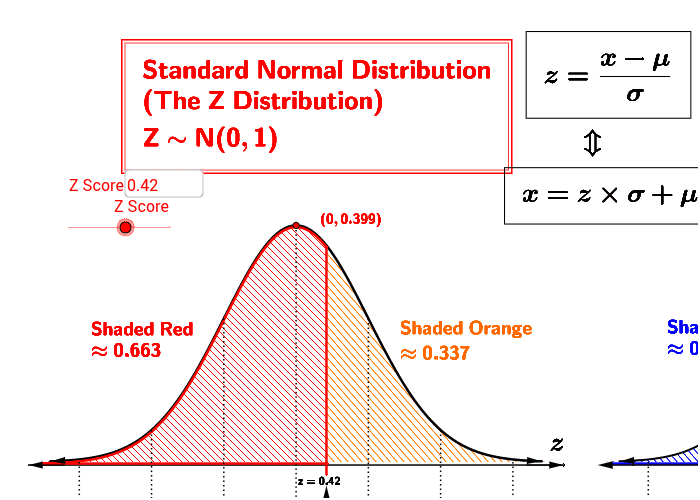
This example demonstrates the relationship between Z-scores and quantiles in a geometric distribution, visually showcasing data distribution characteristics. Core math concepts include Z-score calculation, normal distribution, quantiles, and geometric distribution properties. Construction highlights involve using Function to plot functions, Intersect to find intersections, Point to create points, Vector to generate vectors, Segment to draw line segments, Integral for integration, Textfield to add text, Line to draw lines, Translate for translation, Max to find maximum values, and InverseNormal for inverse normal distribution. Suitable for high school students and math enthusiasts studying probability statistics and data analysis.
GeoGebra Commands & Parameters
Function(exp((-(x)^(2)) / 2) / (sqrt(2 * π) * abs(1)), -3.4, 3.4) → fFunction(0 * x - 0.0050, -3.7, 3.7) → aIntersect(a, b) → BIntersect(f, e, (-1, 0.24197072451914337)) → CIntersect(a, e) → DIntersect(f, d, (1, 0.24197072451914337)) → EIntersect(f, a, (-11.403406098005684, 2.309876005005087E-29)) → FIntersect(a, d) → GIntersect(f, j, (-2, 0.05399096651318806)) → HIntersect(f, a, (-11.40340609634047, 2.3098760488675827E-29)) → IIntersect(a, j) → JIntersect(f, i, (2, 0.05399096651318806)) → KIntersect(f, a, (-11.403406096916385, 2.3098760336977258E-29)) → LIntersect(a, i) → MPoint(f) → NPoint(f) → OVector(O, N) → uPoint(f) → PPoint(f) → QVector(Q, P) → vPoint(a) → RPoint(a) → SPoint(a) → TPoint(a) → UVector(S, T) → wVector(R, U) → zIntersect(a, f, (-11.403406096339166, 0)) → WIntersect(a, f, (-11.403406096390832, 0)) → ZSegment(H, (-2, -0.06)) → kSegment(C, (-1, -0.06)) → gSegment(A, (0, -0.06)) → cSegment(E, (1, -0.06)) → hSegment(K, (2, -0.06)) → lIntegral(f, -3.6, zscore) → AreaUnderTextfield(zscore) → inputBox1Function(f(x) - 0.0030, -3.5, zscore) → AreaCurveIntegral(a(x) + 0.0050, -3.6, zscore) → AddABitUnderFunction(a(x) + 0.0025, -3.5, zscore) → AreaxSegment((zscore, -0.02), (zscore, AreaCurve(zscore))) → AreaRightTextfield(XDistStandardDeviation) → inputσTextfield(XDistMean) → inputμLine(D_1, xAxis) → mPoint(m) → E_1Vector(D_1, E_1) → nFunction(exp((-(x - ndist)^(2)) / 2) / (sqrt(2 * π) * abs(1)), -3.4 + ndist, 3.4 + ndist) → fTransVector((x(Q) + ndist, y(Q)), (x(P) + ndist, y(P))) → v'Translate(h, n) → h'Translate(l, n) → l'Segment((3, 0), (3, -0.06)) → ThreeSigRightTranslate(ThreeSigRight, n) → ThreeSigRight'Translate(c, n) → c'Translate(g, n) → g'Segment((-3, 0), (-3, -0.06)) → ThreeLeftTranslate(ThreeLeft, n) → ThreeLeft'Translate(k, n) → k'Max(f, -2, 2) → MaxZDistTranslate(U, n) → U'Translate(R, n) → R'Translate(S, n) → S'Translate(T, n) → T'Segment(S', R') → pVector(R', U') → qVector(S', T') → rTranslate(AreaRight, n) → AreaRight'Integral(fTrans, -3.6 + ndist, zscore + ndist) → TAreaUnderFunction(a(x + ndist) + 0.0025, -3.5 + ndist, zscore + ndist) → TAreaMax(exp((-((x - XDistMean) / XDistStandardDeviation)^(2)) / 2) / (sqrt(2 * π) * abs(XDistStandardDeviation)), XDistMean - 1, XDistMean + 1) → FindNewMaxTranslate(MaxZDist, n) → MaxZDist'Vector((x(O) + ndist, y(O)), (x(N) + ndist, y(N))) → u'Translate(ZScorePt, n) → ZScorePt'Translate(PtToTranslate, n) → PtToTranslate'Vector(ZScorePt', PtToTranslate') → sInverseNormal(0, 1, AreaUnder) → InvNormIntegral(f, zscore, 3.5) → RightAreaUnderIntegral(fTrans, zscore + ndist, 3.6 + ndist) → RightAreaXDistVector((zscore, -0.175), (zscore, -0.04)) → ShowZscoreQuantile
AI Drawing Prompt Reference
Draw a normal distribution curve and a horizontal line below it, marking their intersection points. Plot several points on the normal curve and connect them to the corresponding points on the horizontal line to form small rectangles. Calculate and display the area of these rectangles, as well as the area between the normal curve and the horizontal line. Also, show the standard normal distribution, marking the mean and standard deviation.
The prompt above was compiled from the original drawing commands and is for reference only.