
Buffon's Needle Experiment
Loading the math board and drawing, please wait…
In collections
Pi Approximations
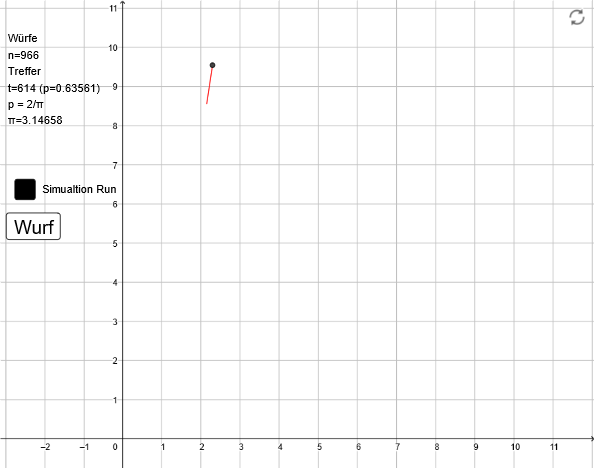
Buffon's needle experiment demonstrates a probability problem involving random processes. This example uses the concept of probability and statistics to estimate the value of π through a needle-throwing simulation. GeoGebra commands are used to construct the intersection points between needles and lines, and the frequency of these intersections is used to estimate π. Suitable for high school mathematics education and probability statistics learning.
GeoGebra Commands & Parameters
Segment(A, Point[Circle[A, 1], random()]) → fRemoveUndefined(Sequence[Intersect[Line[(k, 0), (k, 1)], f], k, 0, 10]) → CHK
AI Drawing Prompt Reference
Create a visualization of Buffon's needle experiment, showing a horizontal line and multiple needles randomly thrown from points on this line. Display the intersection points between the needles and the line, and use the frequency of these intersections to estimate π. The graph should illustrate the random throwing of needles and the statistical counting of intersection points, suitable for probability and statistics education.
The prompt above was compiled from the original drawing commands and is for reference only.