
Areas Under a Normal Curve: Approximating Probabilities with Riemann Sums
Loading the math board and drawing, please wait…
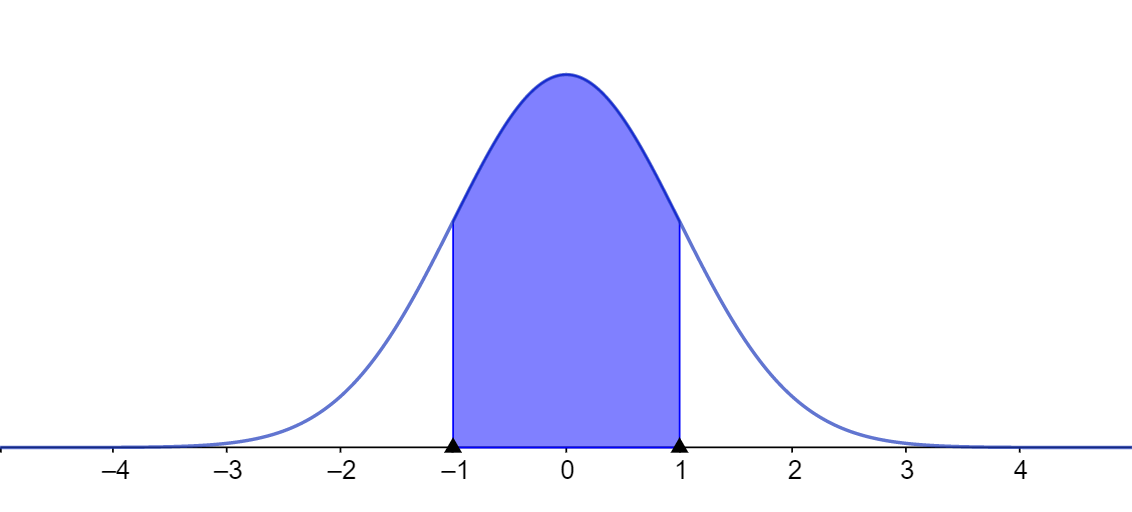
This example demonstrates how to approximate the area under a normal (Gaussian) curve using partitioned rectangles or trapezoids, illustrating that the area corresponds to probabilities (e.g., upper/lower tail areas). The key concepts are the normal distribution function, geometric area interpretation of probability, upper and lower sum (bounding approximations), and the Riemann sum idea that approaches the exact value as the partition gets finer—connecting intuition to integration in the limit. Construction typically involves defining the normal curve y=f(x) in GeoGebra, choosing an interval or threshold to mark the desired region, generating subdivision points, drawing the corresponding rectangles/trapezoids for upper/lower sums, and (often) using a slider for the number of subintervals to show convergence of the approximations. Suitable for high school through first-year college courses in probability & statistics and introductory calculus/numerical approximation.
AI Drawing Prompt Reference
Please draw a normal distribution curve and mark an interval or threshold to indicate the desired region. Generate subdivision points and draw rectangles or trapezoids under the curve to approximate the area. Show upper and lower sums to illustrate probability regions. Use a slider to adjust the number of subdivisions to demonstrate the convergence of approximations as the partition gets finer.
The prompt above was compiled from the original drawing commands and is for reference only.