
Numerical Damped Mass–Spring Response via ODE Solving
Loading the math board and drawing, please wait…
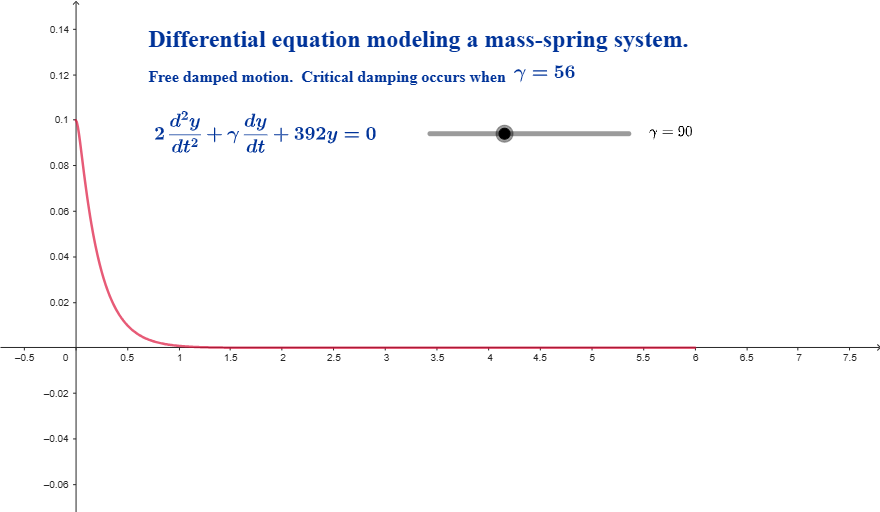
This example demonstrates how a damped mass–spring system vibrates and decays under different damping coefficients γ, visualized through solution plots and surface-style comparisons. It centers on a second-order linear ordinary differential equation with damping, connecting derivatives of the state variables to the system’s time response. Key construction choices include using GeoGebra’s SolveODE to compute the numerical solution, treating γ as a parameter, and employing numericalIntegral1 to obtain integral-based quantities used in the visualization or derived metrics. Additional text objects (text1–text4) annotate the equation, parameter values, and what each curve/surface represents. The example is well suited for instruction in differential equations, numerical methods, and mathematical modeling at the high-school advanced level and early university courses.
GeoGebra Commands & Parameters
SolveODE(γ / 2, 196, 0, 0, 0.1, 0, 6, 0.01) → numericalIntegral1
AI Drawing Prompt Reference
Create a plot showing the numerical response of a damped mass-spring system over time. The horizontal axis represents time, and the vertical axis represents displacement. Display multiple curves for different damping coefficients, each starting at the origin and showing oscillatory motion with decreasing amplitude. Higher damping leads to faster decay. Annotate the plot with the differential equation, damping coefficient values, and labels explaining what each curve represents. The layout should be clear for comparing responses under various damping conditions.
The prompt above was compiled from the original drawing commands and is for reference only.