
Logistic Model: Geometric Display of Exponential Growth and Saturation
Loading the math board and drawing, please wait…
In collections
MATH1052-edX
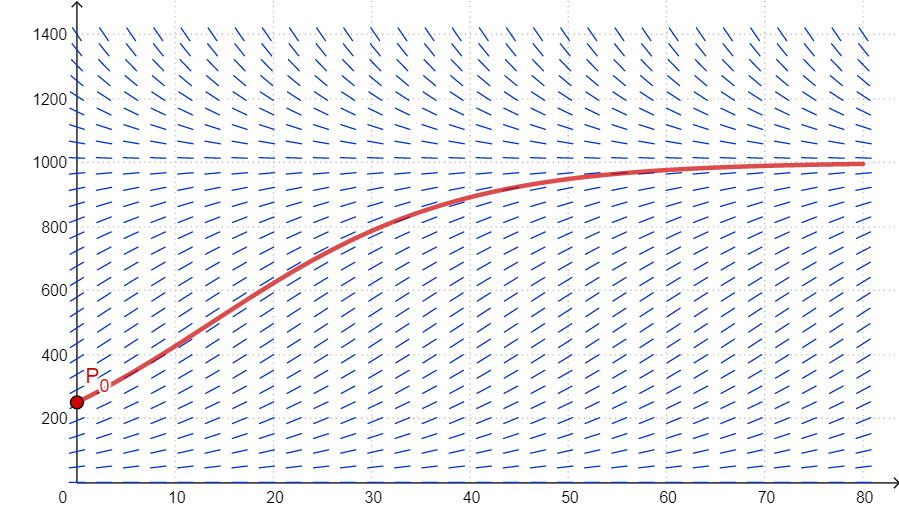
The Logistic model demonstrates the balance between population growth and environmental carrying capacity. Key mathematical concepts include exponential growth, differential equations, and saturation curves. Construction involves using GeoGebra's SlopeField and SolveODE commands, with buttons controlling initial values r and slope f to dynamically display curve changes. Suitable for high school students learning differential equations and probability statistics, applicable in mathematical modeling teaching scenarios.
GeoGebra Commands & Parameters
SlopeField(f, 30, 1, 0, 0, 80, 1400) → slopeFSolveODE(f, x(A), y(A), 80, 0.01) → sol
AI Drawing Prompt Reference
Create a visualization of a Logistic model showing population growth balanced with environmental carrying capacity. Include a slope field displayed in the coordinate system with short line segments indicating directional vectors at various points, where the slopes transition from steep on the left to gradually flattening. Also plot a solution curve starting from a point on the left side, rising rapidly at first, then slowing its rate of increase, and finally approaching a horizontal asymptote, exhibiting an S-shaped curve that demonstrates exponential growth transitioning to saturation.
The prompt above was compiled from the original drawing commands and is for reference only.