
Geogebra Bino Stat: Binomial and Hypergeometric Distribution Demo
Loading the math board and drawing, please wait…
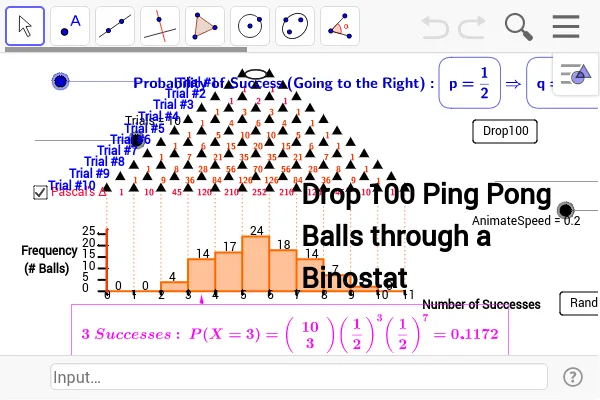
Geogebra Bino Stat demonstrates the process of sampling under binomial and hypergeometric distributions using an animated ball‑dropping experiment that records successes and failures. The core mathematics includes probability theory, hypergeometric distribution, combinatorics, binomial coefficients, and geometric properties such as perimeter and ellipse parameters. The construction leverages GeoGebra commands like Element, Sequence, If, Take, Frequency, Mod, Sum, Circle, Histogram, Segment, and Vector, together with objects such as SuccessDenoms, ProbabilitySuccess, and matrix to generate dynamic simulations and visual histograms. This example is suitable for high‑school and early university students in probability and statistics courses, experimental labs, and data‑visualization activities.
GeoGebra Commands & Parameters
Element(SuccessDenoms, ProbabilitySuccess) → ProbSuccessFailDenomElement(SuccessNums, ProbabilitySuccess) → ProbSuccessNumSequence(100 * Mod[i - 1, Trials] + Trials * Div[i - 1, Trials] + 1, i, 1, Trials * 100) → SumStartsSequence(m, m, S_x - Trials / 2 - 0.5, S_x + Trials / 2 + 0.5) → ClassBoundariesSequence(S_x - Sum[Take[OneHundredDrops, Element[SumStarts, m], Element[SumStarts, m] + Trials - 1]], m, 1, 100) → SumsInOrderIf(Animate100 < Trials - 0.25, 0, Animate100 - Trials) → FinishedCountTake(SumsInOrder, 1, FinishedCount) → ResultsFrequency(ClassBoundaries, Results) → OutcomesIf(floor(Animate100) ≟ Animate100, 0, 0.03) → BounceFactorMod(Animate100 - 1, Trials) → Ball_1VertSum(Take[OneHundredDrops, Div[Animate100 - 1, Trials] * Trials + 1, Animate100]) → Ball_1CountIf(BallDrop ≟ 0, 0, Sum[Take[OneHundredDrops, Element[SumStarts, WhichBallOf100], Element[SumStarts, WhichBallOf100] + BallDrop - 1]]) → PickOneBallCountSequence(Sequence[(S_x + i - 0.5 * j, S_y - j), i, 0, j], j, 1, Trials + 1) → matrixCircle(PickOneBallPt, 0.4) → PickOneBallCircle(PickOneBallPt, 0.4) → c_2Sum(Outcomes) → TotalOutcomesCircle(Ball_1, 0.4) → Ping_1Sum(Take[OneHundredDrops, Ball_2Start, Ball_2End]) → Ball_2CountMod(Ball_1Vert - 1, Trials) → Ball_2VertCircle(Ball_2, 0.4) → Ping_2Mod(Ball_1Vert - 2, Trials) → Ball_3VertSum(Take[OneHundredDrops, Ball_3Start, Ball_3End]) → Ball_3CountCircle(Ball_3, 0.4) → Ping_3Take(OneHundredDrops, 201, 300) → CheckSum(Take[OneHundredDrops, Ball_4Start, Ball_4End]) → Ball_4CountMod(Ball_1Vert - 3, Trials) → Ball_4VertCircle(Ball_4, 0.4) → Ping_4Sum(Take[OneHundredDrops, Ball_5Start, Ball_5End]) → Ball_5CountMod(Ball_1Vert - 4, Trials) → Ball_5VertCircle(Ball_5, 0.4) → Ping_5Mod(Ball_1Vert - 5, Trials) → Ball_6VertSum(Take[OneHundredDrops, Ball_6Start, Ball_6End]) → Ball_6CountCircle(Ball_6, 0.4) → Ping_6Mod(Ball_1Vert - 6, Trials) → Ball_7VertSum(Take[OneHundredDrops, Ball_7Start, Ball_7End]) → Ball_7CountCircle(Ball_7, 0.4) → Ping_7Mod(2.5, 1) → Try3Circle((S_x, S_y - 1 - Mod[Animate100, 1]), 0.4) → Ping_1StartCircle((S_x, S_y - 1 - Mod[Animate100, 1]), 0.4) → Ping_3StartCircle((S_x, S_y - 1 - Mod[Animate100, 1]), 0.4) → Ping_2StartCircle((S_x, S_y - 1 - Mod[Animate100, 1]), 0.4) → Ping_4StartCircle((S_x, S_y - 1 - Mod[Animate100, 1]), 0.4) → Ping_5StartCircle((S_x, S_y - 1 - Mod[Animate100, 1]), 0.4) → Ping_6StartSequence(Segment[(Element[ClassBoundaries, i], 0), (Element[ClassBoundaries, i], S_y - Trials - 1.5)], i, 1, Trials + 2) → SlotsElement(Outcomes, IndexOf[floor(Element[SumsInOrder, Animate100 - Trials]), CeilClassBounds]) → Vector_yElement(SumsInOrder, Animate100 - Trials) → Vector_xCircle((S_x, S_y - 1 - Mod[Animate100, 1]), 0.4) → Ping_7StartElement(Outcomes, IndexOf[ceil(Element[SumsInOrder, ceil(Animate100 - Trials)]), ceil(ClassBoundaries)]) → V_y1Sum(Take[OneHundredDrops, Ball_8Start, Ball_8End]) → Ball_8CountMod(Ball_1Vert - 7, Trials) → Ball_8VertCircle(Ball_8, 0.4) → Ping_8Circle((S_x, S_y - 1 - Mod[Animate100, 1]), 0.4) → Ping_8StartMod(Ball_1Vert - 8, Trials) → Ball_9VertSum(Take[OneHundredDrops, Ball_9Start, Ball_9End]) → Ball_9CountCircle(Ball_9, 0.4) → Ping_9Circle((S_x, S_y - 1 - Mod[Animate100, 1]), 0.4) → Ping_9StartMod(Ball_1Vert - 9, Trials) → Ball_0VertSum(Take[OneHundredDrops, Ball_0Start, Ball_0End]) → Ball_0CountCircle(Ball_0, 0.4) → Ping_0Circle((S_x, S_y - 1 - Mod[Animate100, 1]), 0.4) → Ping_0StartElement(FailNums, ProbabilitySuccess) → ProbFailNumSequence(Sequence[(S_x + i - 0.5 * j, S_y - j), i, 0, j], j, 1, Trials + 1) → matrix2Sequence(Segment[(Element[ClassBoundaries, i], 0), (Element[ClassBoundaries, i], -0.25)], i, 1, Trials + 2) → HistoxticsSequence(Text[LaTeX[i - 1], (Element[ClassBoundaries, i] - 0.1, -0.7)], i, 1, Trials + 2) → list1Sequence(Trials / 2 - Sum[Take[OneHundredDrops, Element[SumStarts, m], Element[SumStarts, m] + Trials - 1]], m, 1, 100) → SumsAsOutcomesElement(SumStarts, B) → TraceStartSum(Take[OneHundredDrops, 1, 1 + TraceStart]) → Trace_AHistogram(false, ClassBoundaries, Results, true, 0.2) → GrowHistoIf(Mod[Animate100, 1] ≟ 0.5 ∨ Mod[Animate100, 1] ≟ 0.5, Vector[(Vector_x, S_y - Trials - 2), (Vector_x, (Vector_y * 0.2 + S_y - Trials - 2) / 2)]) → u_2Sequence(i, i, 0, Trials) → AllOutcomesElement(Frequency[AllOutcomes, Take[SumsAsOutcomes, 1, B]], NumberOfSuccesses + 1) → B3If(TraceShow ∧ (¬TracesHide), Sequence[Segment[(S_x - 0.4 + 0.8 / B2 * B3 - Sum[Take[OneHundredDrops, TraceStart, TraceStart + i]], S_y - i - 2), (S_x - 0.4 + 0.8 / B2 * B3 - Sum[Take[OneHundredDrops, TraceStart, TraceStart + i + 1]], S_y - i - 3)], i, 0, Trials - 2]) → TraceIf(TraceShow ∧ (¬TracesHide), Segment[(S_x, S_y - 1), (S_x - 0.4 + 0.8 / B2 * B3 - Sum[Take[OneHundredDrops, TraceStart, TraceStart]], S_y - 2)]) → Trace2Sequence(Segment[(Element[ClassBoundaries, 1] - 0.3, i * 0.2), (Element[ClassBoundaries, 1], i * 0.2)], i, 0, maxverticalscale, 5) → verticalticsSegment((Element[ClassBoundaries, 1], 0), (Element[ClassBoundaries, 1], (maxverticalscale + 2) * 0.2)) → yaxisSequence(Text[LaTeX[Element[Outcomes, i]], (Element[ClassBoundaries, i] + 0.3, Element[Outcomes, i] * 0.2 + 0.1)], i, 1, Trials + 1) → LabelHistoOutcomesSequence(Text[LaTeX[i], (Element[ClassBoundaries, 1] - 0.9, i * 0.2 - 0.1)], i, 0, maxverticalscale, 5) → VerticalScaleIf(Mod[Animate100, 1] ≟ 0.75 ∨ Mod[Animate100, 1] ≟ 0.75, Vector[(Vector_x, (S_y - Trials - 2 + Vector_y * 0.2) / 2.05), (Vector_x, Vector_y * 0.23)]) → u_1Vector(ExPoint, ExPoint2) → uSegment(ExPoint3, ExPoint) → a
AI Drawing Prompt Reference
Demonstrate an animated ball-dropping experiment simulating binomial and hypergeometric distributions, recording successes and failures. Use a histogram to show the frequency distribution of sampling results, and represent the positions of successfully dropped balls with colored circles in each trial, dynamically illustrating probability theory, combinatorics, and geometric properties.
The prompt above was compiled from the original drawing commands and is for reference only.