
Introduction to Exponents and Logs Activity
Loading the math board and drawing, please wait…
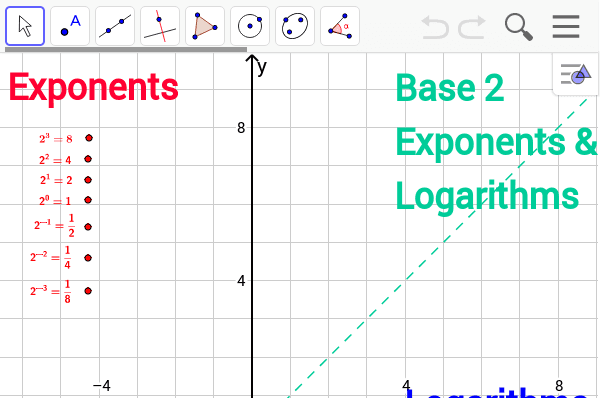
This activity demonstrates the relationship between exponential and logarithmic functions. Key mathematical concepts include exponents, logarithms, geometric distribution, and random variables. Construction involves using GeoGebra commands such as A, B, C, D, E, F, G, H, I, J, K, L, M, N, O, P, Q, R, S, T, U, V, W, X, Y, Z to create graphical representations. Suitable for middle or high school mathematics teaching to understand basic properties and transformations of exponential and logarithmic functions.
GeoGebra Commands & Parameters
Point A(-4.2641397174307665, 7.73184674123261)Point B(-4.290284089012562, 7.1828149380148965)Point C(-4.290284089012562, 6.6337831347971825)Point D(-4.290284089012562, 6.1108957031612645)Point E(-4.290284089012562, 5.404997670452776)Numeric a(0.5)Point F(-4.290284089012562, 4.594522151417102)Point G(6.219753286869394, -1.340250197650566)Point H(6.219753286869394, -0.5820634217784855)Point I(6.24589765845119, -1.9677151156136674)Point J(6.219753286869394, -3.3533668094488496)Point K(6.24589765845119, -2.5951800335767685)Line b(-1.0, 1.0, 0.0)Point L(6.219753286869394, -4.346852929557093)Point M(6.2197532868693965, -5.183472820174566)Point N(-4.290284089012562, 3.731757889217838)
AI Drawing Prompt Reference
Draw a graph with points A, B, C, D, E, F, G, H, I, J, K, L, M, N. Points A and N are on the left, while points G to M are on the right. Points F, H, I, J, K, L, M form a vertical line. Points B, C, D, E are below point F. Points G, H, I, J, K, L, M have a logarithmic relationship with points B, C, D, E. The graph illustrates basic properties and transformations of exponential and logarithmic functions.
The prompt above was compiled from the original drawing commands and is for reference only.