
Symmetry in Cosine and Tangent
Loading the math board and drawing, please wait…
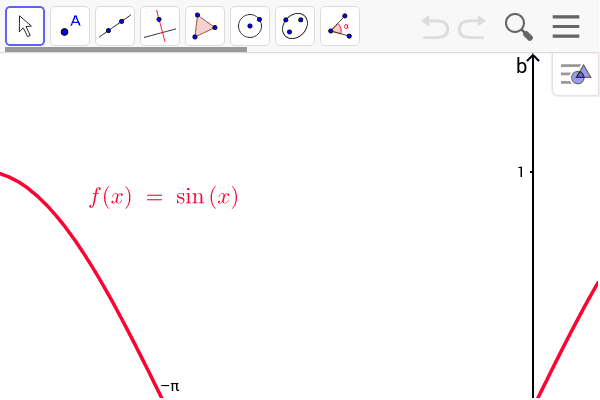
This example demonstrates the symmetry properties of cosine and tangent functions through their graphical representations. It involves core math concepts like trigonometric functions, symmetry, and function graphing. The construction uses GeoGebra objects: f (function), a, b (parameters), g, h (auxiliary objects). Suitable for high school mathematics teaching or student exploration of trigonometric properties.
GeoGebra Commands & Parameters
f(x) = sin(x)Line a(0.0, 1.0, 0.0)Line b(1.0, 0.0, 0.0)g(x) = f(-x)h(x) = -g(x)
AI Drawing Prompt Reference
Draw the graphical representation of the symmetry properties of cosine and tangent functions, start by plotting the sine function, then draw two coordinate axes, next plot the image of the sine function that is symmetric about the origin, and finally plot the negative image of this symmetric function to show the symmetry and transformation relationships of the functions.
The prompt above was compiled from the original drawing commands and is for reference only.