
Graphical Principle of Solving Simple Trigonometric Equations
Loading the math board and drawing, please wait…
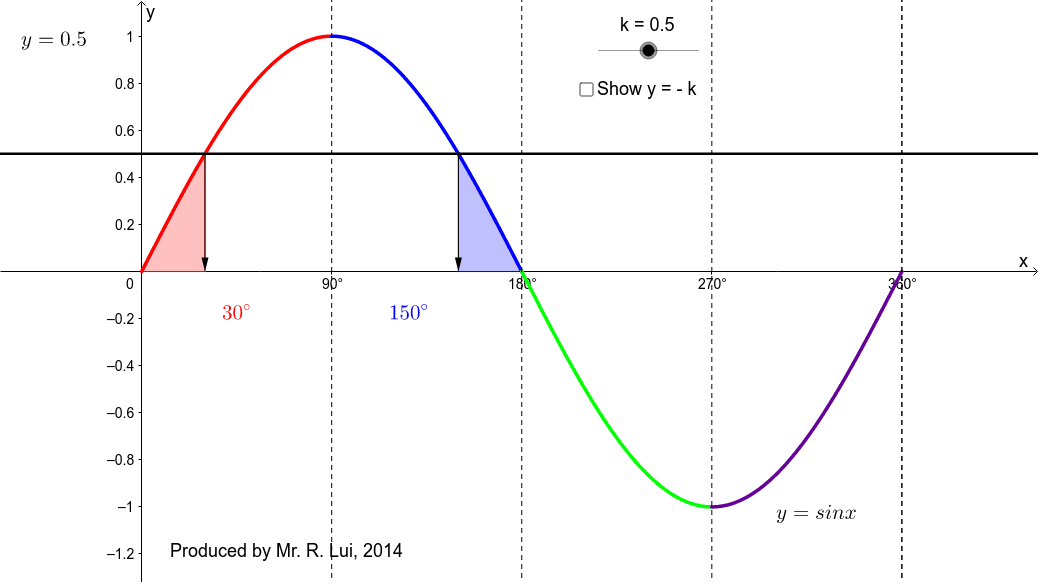
This example demonstrates the graphical method for solving trigonometric equations of the form sin x = k. It involves core concepts like trigonometric function graphs, unit circle, and intersection solving. GeoGebra commands used include Function, Mirror, Rotate, Intersect, Integral, and Vector, with objects like f, g, a, b, c, d, etc. It is suitable for high school mathematics instruction or student exploration of trigonometric equation solving techniques.
GeoGebra Commands & Parameters
Function(sin(x°), 0, 90) → gMirror(g, a) → g_1Rotate(g_1, 180*°, A) → eMirror(e, c) → e'Intersect(g, h_1, (-1049.999999999999, 0.5000000000000155)) → BIntegral(g, 0, asin(k) * 180 / π) → iIntegral(f, 180 - asin(k) * 180 / π, 180) → jIntersect(h, e) → DIntersect(h, e') → EIntegral(sin(x°), 180, 180 + asin(k) * 180 / π) → mIntegral(sin(x°), 360 - asin(k) * 180 / π, 360) → nVector(J, F) → uVector(K, G) → vVector(L, H) → wVector(M, I) → z
AI Drawing Prompt Reference
Draw a sine function graph from 0 to 90 degrees and demonstrate solving sin x = k graphically. First, plot the sine curve, then reflect it over the x-axis, rotate 180 degrees, and reflect again over the y-axis. Find the intersection points between the sine curve and a horizontal line y=k in the first and fourth quadrants, and connect these points to the origin to form parts of a unit circle. Finally, calculate and display the areas enclosed by the sine curve and the horizontal line to illustrate the geometric meaning of the solutions.
The prompt above was compiled from the original drawing commands and is for reference only.