
Sine Graph by Roger Lui
Loading the math board and drawing, please wait…
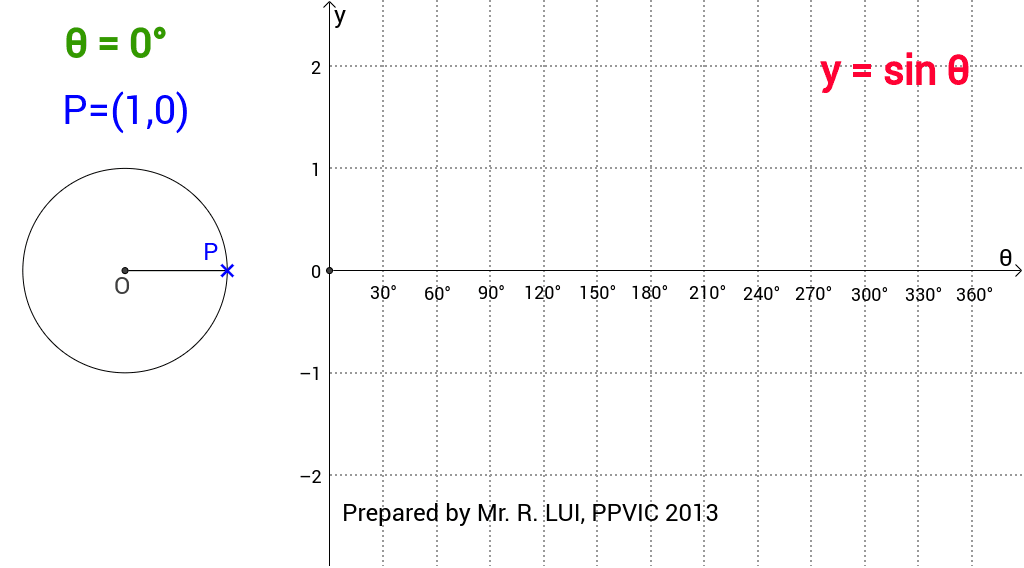
This example demonstrates the generation process of the sine graph. By dragging point P on the unit circle, observe the relationship between the angle and the y-coordinate, and predict the shape of the sine function. Commands used include Point, Segment, Angle, and Text. Suitable for middle school mathematics education.
GeoGebra Commands & Parameters
Point(c) → PSegment(P, O) → aSegment(B, O) → bAngle(B, O, P) → αText("30°") → text1Text("60°") → text2Text("90°") → text3Text("120°") → text4Text("150°") → text5Text("180°") → text6Text("360°") → text7Text("210°") → text8Text("240°") → text9Text("270°") → text10Text("300°") → text11Text("330°") → text12Text("θ = " * α) → text13Text("P=(" * e * "," * d * ")") → text14Text("y = sin θ") → text15
AI Drawing Prompt Reference
Draw a unit circle and drag point P on it to observe the relationship between angle α and the y-coordinate of point P. Mark angles such as 30°, 60°, 90°, 120°, 150°, 180°, 210°, 240°, 270°, 300°, and 330° on the circle, display the angle α and the coordinates of point P (x, y), and finally show the sine function y = sin θ.
The prompt above was compiled from the original drawing commands and is for reference only.