
Interactive map of rectangles - area & perimeter
Loading the math board and drawing, please wait…
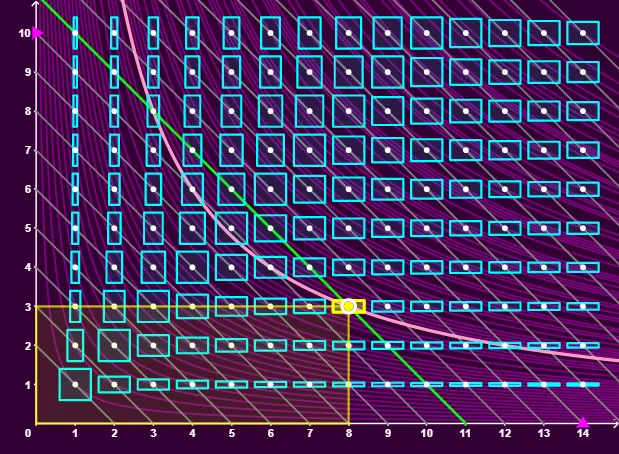
This example demonstrates the plotting of all rectangles with integer dimensions on a graph, along with iso-perimeter and iso-surface area curves for the selected rectangle. Key math concepts include area, perimeter, coordinate geometry, isoperimetric inequality, correlation, and scatter plots. It uses GeoGebra commands like Point, Sequence, Unique, Sort, Element, Segment, Polygon for construction. Suitable for high school mathematics education to explore geometric properties and optimization problems.
GeoGebra Commands & Parameters
Point(yAxis) → BPoint(xAxis) → ASequence(Sequence[Translate[Dilate[Polygon[(i, j), ((-i), j), ((-i), (-j)), (i, (-j))], 2 / ((5 * Max[i, j]))], (i, j)], i, 1, n], j, 1, p) → l1Sequence(Sequence[(i, j), i, 1, n], j, 1, p) → l2Unique(Flatten[Sequence[Sequence[(i * j), i, 1, n], j, 1, p]]) → laSort(la) → l4Sequence(Element[la, k] / x, k, 1, Length[la]) → l5Sequence(Segment[(i + 1, 0), (0, i + 1)], i, 1, n + p - 1) → l3Element(Element[l1, j], i) → q1Segment((i + j, 0), (0, i + j)) → gPolygon((0, 0), (i, 0), (i, j), (0, j)) → q2, h, k, l, m