
Tangent Graph Demo
Loading the math board and drawing, please wait…
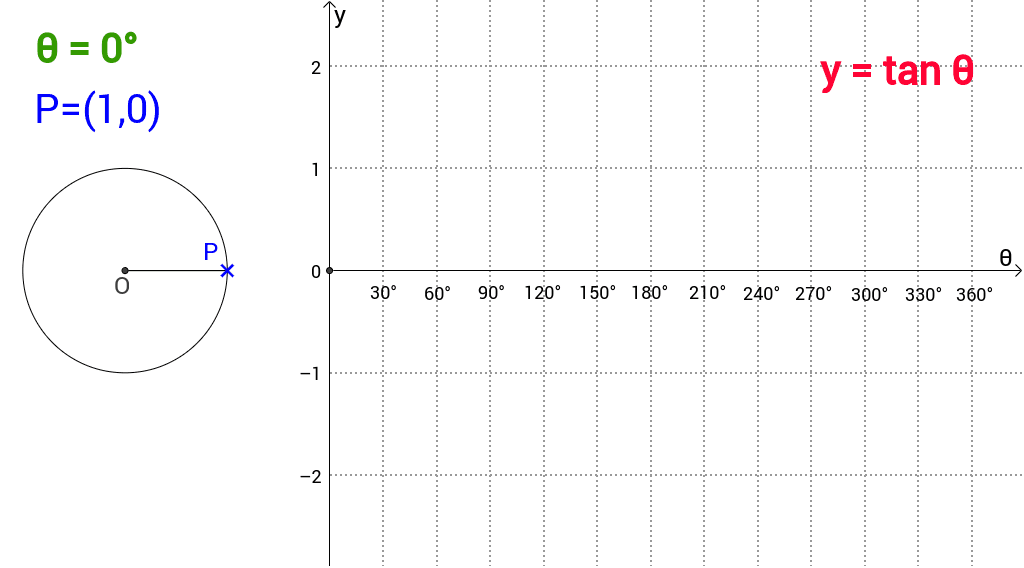
This example demonstrates the construction of the tangent graph derived from a unit circle. It involves core math concepts like the unit circle, trigonometric functions, slope, and angle relationships. The construction uses GeoGebra commands such as Point, Segment, Angle, and Text to create the unit circle, points, angles, and labels. It is suitable for high school mathematics education to help students visually understand the geometric meaning and properties of the tangent function.
GeoGebra Commands & Parameters
Point(c) → PSegment(P, O) → aSegment(B, O) → bAngle(B, O, P) → αText("30°") → text1Text("60°") → text2Text("90°") → text3Text("120°") → text4Text("150°") → text5Text("180°") → text6Text("360°") → text7Text("210°") → text8Text("240°") → text9Text("270°") → text10Text("300°") → text11Text("330°") → text12Text("θ = " * α) → text13Text("P=(" * e * "," * d * ")") → text14Text("y = tan θ") → text15
AI Drawing Prompt Reference
Draw a unit circle and mark points on the circle at 30°, 60°, 90°, 120°, 150°, 180°, 360°, 210°, 240°, 270°, 300°, and 330°. Draw radii from the center to these points. Label each point with its angle value and show its coordinates. Finally, draw the graph of the tangent function, labeled as y = tan θ.
The prompt above was compiled from the original drawing commands and is for reference only.