
Normal Distribution Density Curve Animation
Loading the math board and drawing, please wait…
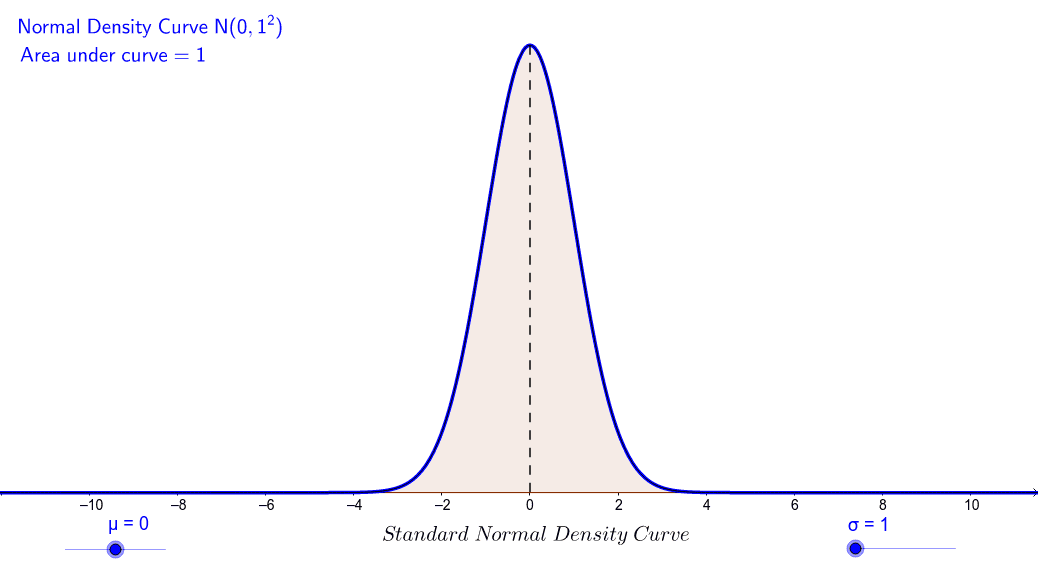
① This example dynamically displays the probability density curve of a normal distribution, allowing users to vary the mean μ and standard deviation σ to see how the curve changes. ② Core mathematical concepts include the normal distribution, probability density function, mean and standard deviation, and the calculation of area under the curve (confidence intervals). ③ Construction highlights: GeoGebra's Segment command creates interval endpoints A and B; the Integral command computes the definite integral of function f over [a, b]; sliders control parameters μ and σ; function object f defines the density; text objects text1, text2, text3 label parameters and the resulting area. ④ Suitable for high‑school statistics electives, undergraduate probability and statistics courses, and self‑learners seeking an intuitive grasp of normal distribution properties.
GeoGebra Commands & Parameters
Segment(B, A) → aIntegral(f, -100, 100) → b
AI Drawing Prompt Reference
Draw an interactive normal distribution density curve with sliders for the mean μ and standard deviation σ; place two movable endpoints on the x‑axis to define an integration interval, show the segment between them, automatically compute and display the area under the curve over that interval (the confidence probability), and label the current μ, σ, and area values beside the plot.
The prompt above was compiled from the original drawing commands and is for reference only.