
LRAM Example (1) – Left Riemann Sum Approximation of a Definite Integral
Loading the math board and drawing, please wait…
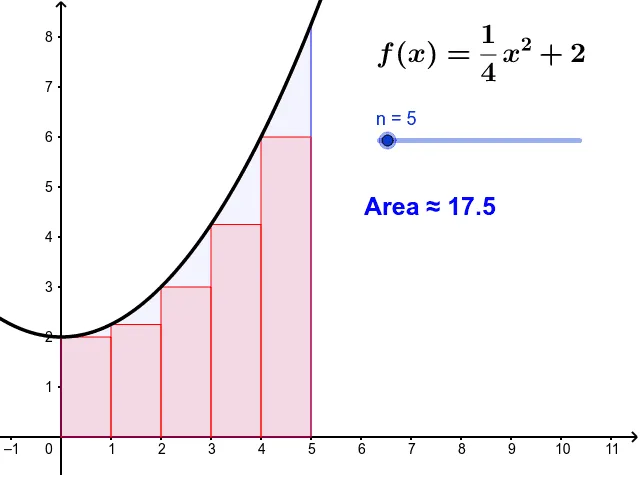
① This example demonstrates the construction of a Left Riemann Sum (LRAM), visually showing how rectangles with left endpoints approximate the area under a curve, which represents the definite integral. ② Core mathematical concepts include the geometric meaning of definite integrals, Riemann sums (left endpoint approximation), interval partitioning, and the limiting process, along with the error between the sum of rectangle areas and the exact integral value. ③ Construction details: The GeoGebra commands Integral and RectangleSum are used to compute the exact integral and generate the left-rectangle sum, respectively. Sliders a, b, and n control the integration interval and the number of subdivisions, while text objects text1 and text2 display the approximate and exact values in real time; the function f is the integrand. ④ Suitable for senior high school or early university calculus students to grasp the intuitive foundation of the definite integral definition, and also useful for teachers as an interactive classroom demonstration or for self-directed exploration.
GeoGebra Commands & Parameters
Integral(f, 0, 5) → aRectangleSum(f, 0, 5, n, 0) → b
AI Drawing Prompt Reference
Draw a graph showing a smooth curve representing a function, and approximate the definite integral from 0 to 5 using left Riemann sums. Display a series of rectangles of equal width, each with height equal to the function value at its left endpoint, covering the interval. Show two numeric values: one for the total area of the rectangles (approximate integral) and one for the exact area under the curve (definite integral). Include sliders to adjust the interval endpoints and the number of rectangles, updating the graph and values dynamically.
The prompt above was compiled from the original drawing commands and is for reference only.