
Rectangle Sum — Visualizing Riemann Sums for Approximating Area Under a Curve
Loading the math board and drawing, please wait…
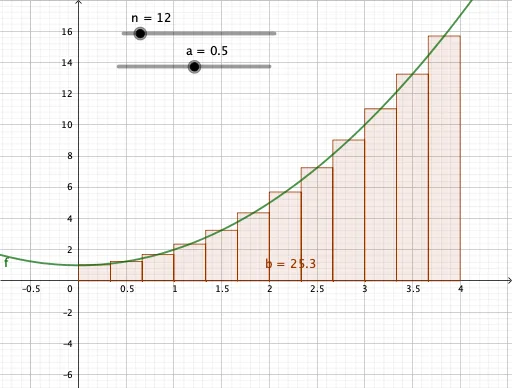
① This example dynamically demonstrates how a series of rectangles can approximate the area under a function curve, providing a classic visual for the geometric meaning of definite integrals. ② Core mathematical concepts include Riemann sums (rectangle sums), definite integrals, function graphing, interval partitioning, and the limit process, with extensions to difference and slope, equations, interest calculation, and probability. ③ Construction highlights: using the GeoGebra command RectangleSum with objects f (function), n (number of rectangles), and a, b (interval endpoints); typically n is controlled by a slider to show how the sum converges to the true area as the partition refines. ④ Suitable for high school to early college calculus courses, AP Calculus, or pre-university math, this tool helps students build an intuitive bridge from discrete summation to continuous integration and explore numerical integration error and convergence.
GeoGebra Commands & Parameters
RectangleSum(f, 0, 4, n, a) → b
AI Drawing Prompt Reference
Draw a coordinate plane with a smooth function curve. Below the curve, from x=0 to x=4, show a series of rectangles approximating the area under the curve. The number of rectangles is controlled by a slider; as the slider increases, the rectangles become narrower and more numerous, closely hugging the curve. The visual should clearly illustrate how the sum of rectangle areas approaches the true area under the curve as the partition refines. Include labeled axes, the curve, the rectangular regions, and a visible slider control.
The prompt above was compiled from the original drawing commands and is for reference only.