
Riemann Sums and Definite Integral Interactive Visualization
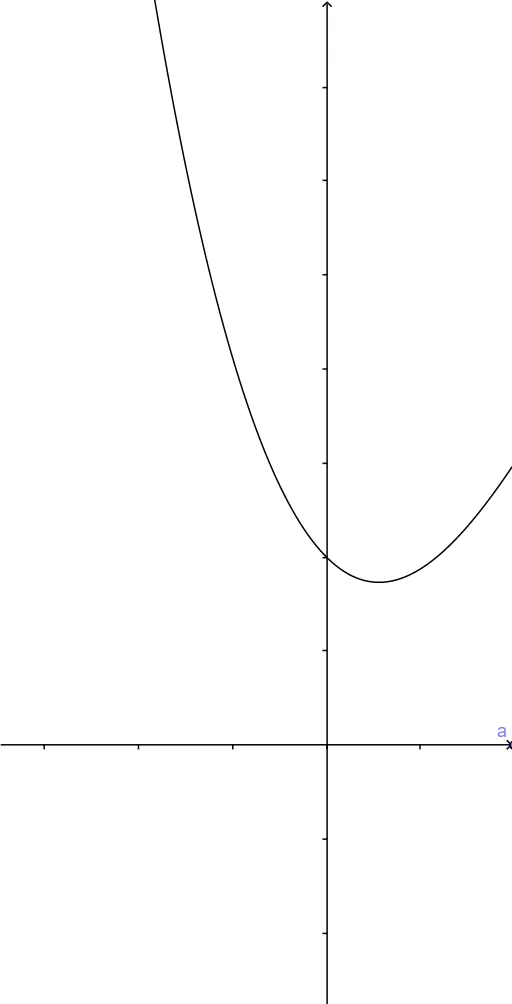
Loading the math board and drawing, please wait…
① This example demonstrates how Riemann sums (left, right, midpoint, upper, and lower) approximate the definite integral of a function as the number of subintervals n increases. ② Core mathematical concepts include the definition of the definite integral, construction of Riemann sums, the limit process, and area approximation under a curve. ③ Construction highlights: GeoGebra commands such as Point, UpperSum, LowerSum, LeftSum, RectangleSum, and Integral are used to create the function, rectangles, and exact integral value; Textfield and InputBox allow interactive input of parameters; checkboxes control visibility of different sums. ④ Suitable for high school advanced students or early college calculus learners to grasp the relationship between Riemann sums and definite integrals, and also useful for classroom demonstrations by teachers.
GeoGebra Commands & Parameters
Point(xAxis) → aPoint(xAxis) → bUpperSum(f, x(a), x(b), n) → uppersumLowerSum(f, x(a), x(b), n) → lowersumIntegral(f, x(a), x(b)) → integralLeftSum(f, x(a), x(b), n) → leftsumRectangleSum(f, x(a), x(b), n, 1) → rightsumRectangleSum(f, x(a), x(b), n, 0.5) → midpointTextfield(f) → InputBox1
AI Drawing Prompt Reference
Create a dynamic visualization of Riemann sums and definite integrals for a function over the interval [a, b]. First, plot the function graph, then use a slider to adjust the number of subintervals n, and display the upper, lower, left, right, and midpoint Riemann sums, as well as the exact value of the definite integral. Control the visibility of different types of Riemann sums with checkboxes.
The prompt above was compiled from the original drawing commands and is for reference only.