
Riemann Sums: Approximating Area Under a Curve with Rectangles
Loading the math board and drawing, please wait…
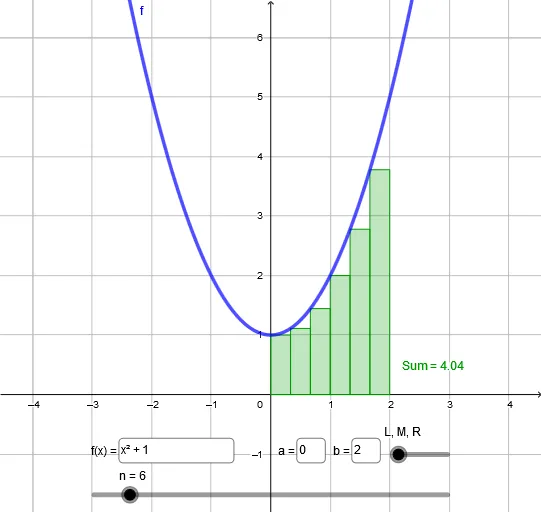
① This interactive GeoGebra example dynamically demonstrates how Riemann sums (sums of rectangle areas) approximate the area under a function curve. ② Core mathematical concepts include the geometric meaning of definite integrals, Riemann sum methods (left, right, or midpoint), the limit process, and how partition refinement improves approximation accuracy. ③ Construction highlights: it uses the RectangleSum command to generate the approximating rectangles, along with Textfield and InputBox2/3/4 to let users modify the function f, interval endpoints a and b, and the number of rectangles n; a slider n₁ controls the partition count, and object c displays the current sum. ④ Suitable for advanced high school or introductory college calculus students to visualize the transition from discrete sums to continuous integrals, and for teachers as a classroom demonstration tool.
GeoGebra Commands & Parameters
Textfield(f) → InputBox2Textfield(a) → InputBox3Textfield(b) → InputBox4RectangleSum(f(x), a, b, n, l) → c
AI Drawing Prompt Reference
Draw a function curve with rectangles below it to approximate the area under the curve, including input boxes for the function, interval endpoints, and number of rectangles, plus a slider showing the current sum of rectangles. Observe how changing the number of rectangles affects the approximation by adjusting the slider and inputs.
The prompt above was compiled from the original drawing commands and is for reference only.