
Riemann Sum (Rectangular Approximation of Definite Integral) Dynamic Demo
Loading the math board and drawing, please wait…
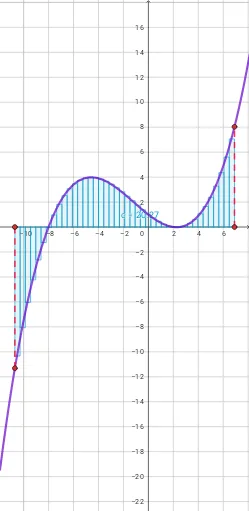
This GeoGebra example dynamically demonstrates the concept of Riemann Sum, using the sum of rectangular areas to approximate the definite integral under a function curve. Core mathematical concepts include definite integral, Riemann sum, upper and lower sums, rectangular partitioning, and the limit process. Construction highlights: the Segment command is used to draw partition lines on the function graph, and the RectangleSum command generates the rectangular sum. Key objects include the function f, interval endpoints a and b, number of rectangles n, and auxiliary points A, B, C, D. A slider for n allows users to adjust the number of rectangles, visually showing how the sum converges to the true integral value as n increases. Suitable for high school to college calculus courses introducing the definition of the definite integral and the idea of approximation, as well as for student exploration of how partition granularity affects the approximation.
GeoGebra Commands & Parameters
Segment(A, B) → gSegment(C, D) → hRectangleSum(f, a, b, n, k) → c
AI Drawing Prompt Reference
Draw a function curve and show its rectangular approximation of the definite integral below. Use straight lines to partition the curve, creating multiple rectangles whose total area approximates the integral. Include a slider to control the number of rectangles, demonstrating how the approximation converges to the true value as the number of rectangles increases.
The prompt above was compiled from the original drawing commands and is for reference only.