
Line Integral Visualization: Integrating Along a Parametric Curve
Loading the math board and drawing, please wait…
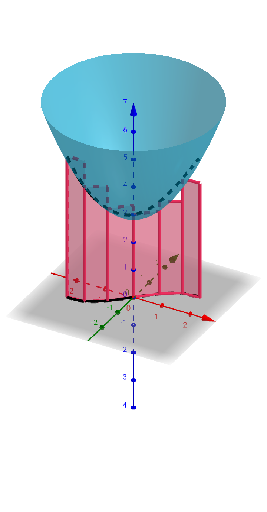
This GeoGebra example demonstrates the concept of a line integral (curve integral) by visualizing the integration of a function along a parametric curve. It shows how the integral accumulates values along the path, often represented as the area under a curve projected onto the path or as a sum of discrete contributions. Core mathematical concepts include definite integrals, line integrals, parametric curves, vector fields, and Riemann sum approximations. The construction uses the CurveCartesian command to define the parametric curve, and the Sequence command to generate a sequence of sample points along the curve. Objects such as f, a, b, n, c, d, e control the function, integration limits, number of subdivisions, and other parameters, while auxiliary objects l1 through l5 (e.g., segments, polygons, or area elements) help visualize the integral sum. This is suitable for university-level calculus or mathematical analysis courses, as well as advanced high school students or teacher demonstrations, providing an intuitive grasp of how line integrals accumulate function values along a path.
GeoGebra Commands & Parameters
CurveCartesian(u, sin(u), 0, u, a, b) → cCurveCartesian(u, sin(u), f(u, sin(u)), u, a, b) → dSequence(a + (e * i), i, 0, n) → l1Sequence((Element[l1, i], sin(Element[l1, i]), 0), i, 1, Length[l1]) → l2Sequence((Element[l1, i], sin(Element[l1, i]), f(Element[l1, i], sin(Element[l1, i]))), i, 1, Length[l1]) → l3Sequence((Element[l1, i + 1], sin(Element[l1, i + 1]), f(Element[l1, i], sin(Element[l1, i]))), i, 1, Length[l1]) → l4Sequence(Polygon[Element[l2, i], Element[l3, i], Element[l4, i], Element[l2, i + 1]], i, 1, Length[l2]) → l5
AI Drawing Prompt Reference
Visualize a line integral: first draw a sine curve y=sin(x) from x=a to x=b on the xy-plane, then lift this curve vertically into 3D space forming a spatial curve; divide the interval into n+1 equally spaced sample points along the x-direction, each generating both a point on the xy-plane and a corresponding point at height f(x,y) in 3D; construct a sequence of quadrilateral strips connecting these points, rising from the xy-plane to the function height, forming a stepped polygonal band that illustrates Riemann sum approximation of the line integral, visually representing area elements of the surface integral.
The prompt above was compiled from the original drawing commands and is for reference only.