
Dynamic Visualization of Definite Integral of Exponential Function
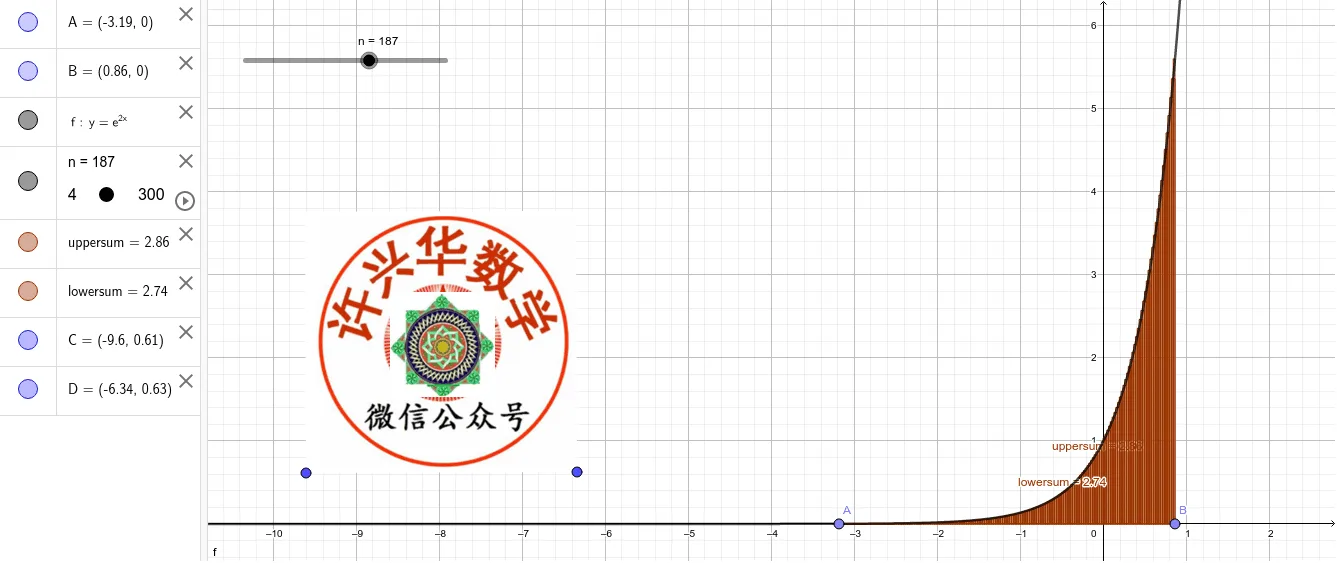
This GeoGebra example dynamically illustrates the definite integral of an exponential function over a specified interval by approximating it with upper and lower Riemann sums. It demonstrates how, as the number of subintervals increases, the upper sum (UpperSum) and lower sum (LowerSum) converge toward the actual integral value. Key mathematical concepts include the definition of the definite integral, Riemann sums, convergence of upper and lower sums, and properties of exponential functions. The construction uses Point objects to define interval endpoints A and B, a slider 'n' to control partition count, and built-in commands UpperSum and LowerSum to generate corresponding area approximations; auxiliary points C, D and image pic1 enhance visual clarity. Ideal for high school calculus enrichment or introductory university-level analysis, this tool helps learners develop an intuitive grasp of integration as a limiting process.
Loading the math board and drawing, please wait…