
Exploring How the Graph of y=x+(a/x) Changes with Parameter a
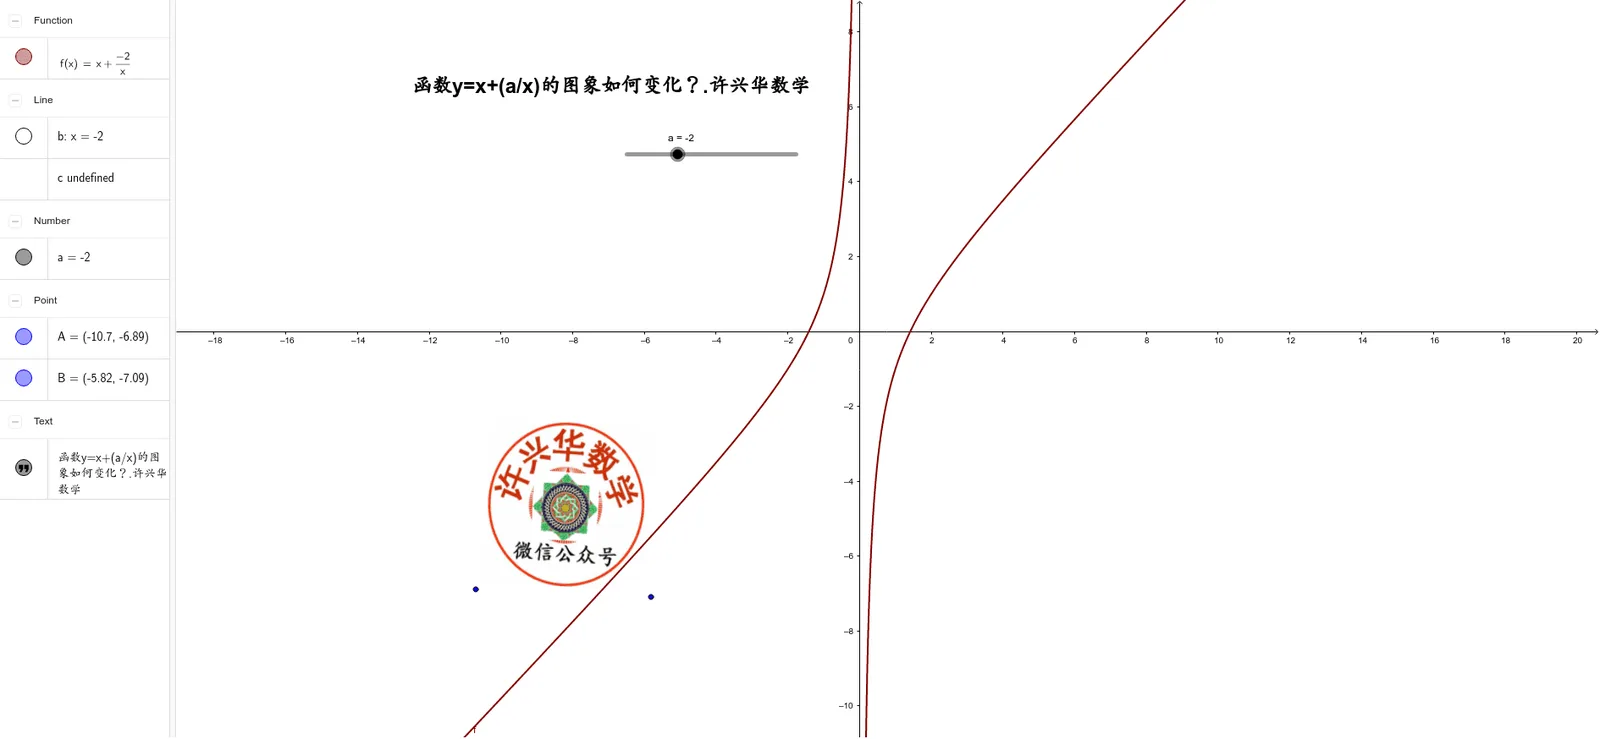
This GeoGebra example demonstrates how the graph of the function y=x+(a/x) changes as the parameter a takes different values. The core mathematical concepts involved include: rational functions, properties of odd functions, domain and range of functions, asymptotes (vertical asymptote x=0 and oblique asymptote y=x), and how parameters affect the shape of function graphs. Construction details: Use slider object a to control parameter variation (Slider command), define function f(x)=x+(a/x) (Function command), label key points A and B with image text, and dynamically demonstrate the graph's bending direction and asymptotic behavior through parameter changes. This example is suitable for high school mathematics courses on function concepts, function graph transformations, and parameter discussions, as well as for student inquiry activities exploring how parameters affect function graphs.
Loading the math board and drawing, please wait…