
Interactive Linear Function Graphing with Point-Plotting Method
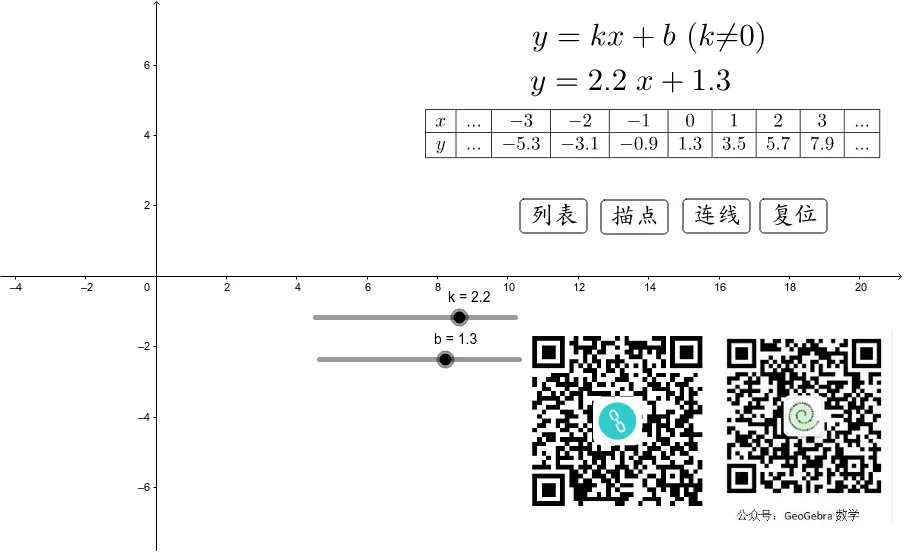
This example demonstrates how to draw the graph of a linear function y=kx+b using the point-plotting method. By dynamically adjusting parameters k (slope) and b (y-intercept), users can observe how the function graph changes. The core mathematical concepts include the definition of linear functions, the geometric meaning of slope and intercept, and methods for plotting function graphs. Construction highlights: using Sequence command to generate x-value sequences, If conditions to construct piecewise function expressions, TableText to display coordinate data in tabular form, LaTeX for mathematical formulas, and button controls for interactivity. This example is suitable for middle school mathematics teaching, particularly for introducing linear function concepts, exploring graph properties, and understanding the relationship between functions and equations. It can also serve as a self-study resource for students to explore function transformation patterns.
Loading the math board and drawing, please wait…