
Graphs of Linear, Quadratic, and Trigonometric Functions
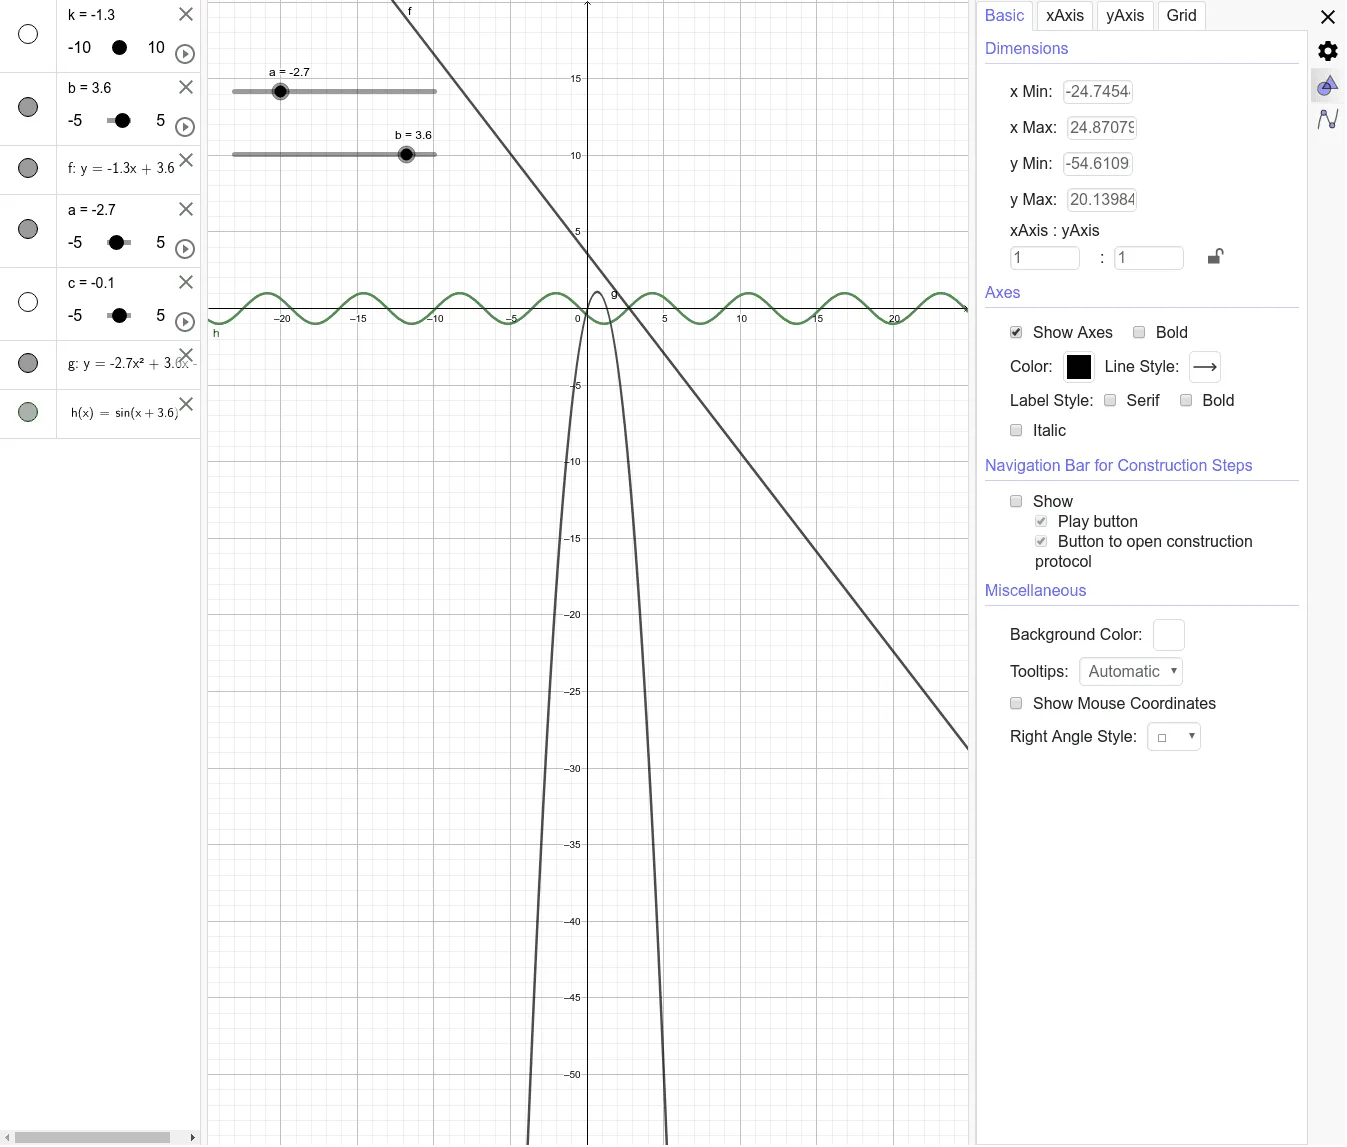
This GeoGebra example dynamically displays the graphs of a linear function, a quadratic function, and a trigonometric (sine) function on the same coordinate plane. It illustrates how parameters affect the shape and position of each graph: sliders k and b define the linear function f(x) = kx + b; sliders a and c control the quadratic function g(x) = ax² + c; and the sine function h(x) = sin(x) is included for comparison. The construction uses objects k, b, f, a, c, g, and h to enable interactive exploration. Ideal for middle to high school mathematics instruction, this tool helps students visualize fundamental function behaviors and parameter dependencies in algebra and trigonometry.
Loading the math board and drawing, please wait…