
Graph of f(x)=cosx: Stretching and Translation
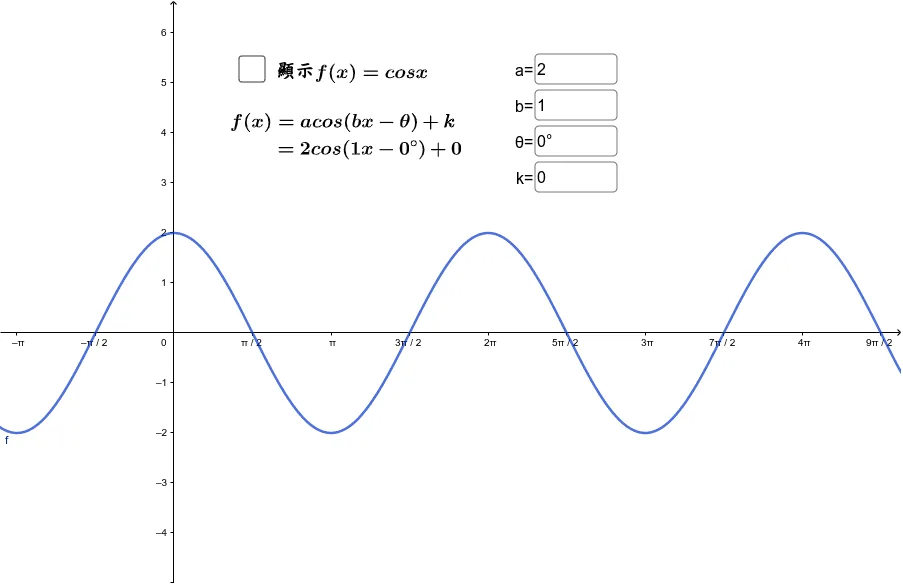
This GeoGebra example demonstrates dynamic stretching and translation of the cosine function f(x)=cosx by adjusting input parameters, allowing visual comparison with the original graph. Core math concepts include amplitude, period, phase shift, and function transformations in trigonometry. Construction uses Textfield command for variable input along with objects k, b, a, b_1, k_1, a_1, θ, θ_1, g, c, text2, text1, f to render comparative curves. Designed for high school math instruction and student exploration of graphing.
Loading the math board and drawing, please wait…