
Graph of the Sine Function
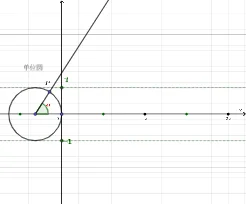
This example demonstrates the complete graph of the sine function y=sin(x) plotted in the coordinate plane. Core concepts include trigonometric periodicity, amplitude, phase shift, and transformations. Construction uses GeoGebra commands Circle, Rotate, Angle, Ray, Segment, CircleArc, Intersect, Sequence, Translate, Point and Vector to create points A, B, C and objects f, g, h, d, with text labels for equations. Ideal for high school trigonometry lessons or precalculus review.
Loading the math board and drawing, please wait…