
Translation of Linear Function Graphs
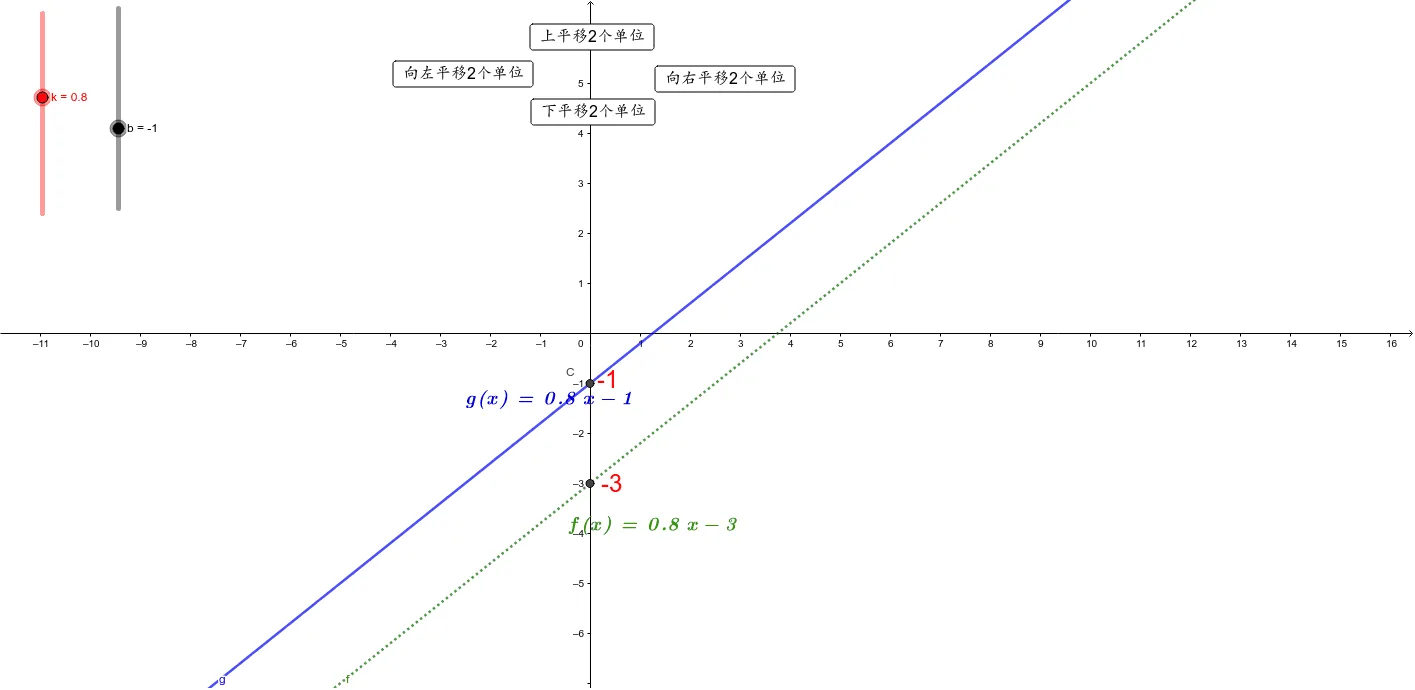
This GeoGebra example provides an interactive demonstration of how the graph of a linear function y = kx + b translates when parameters k and b are changed. The core mathematical concept is the graphical properties of linear functions, especially how the intercept b shifts the graph vertically and how the slope k alters its steepness. The construction uses the Intersect command to find intersection points with axes, Point objects to mark key locations, and LaTeX to display the function formula. Multiple buttons (button1 to button4) and sliders (s_1, s_2, z_1, z_2) are included to control parameter changes, enabling dynamic translation effects. This resource is suitable for middle school mathematics lessons on functions, allowing students to visually explore the geometric meaning of graph transformations.
Loading the math board and drawing, please wait…