
Graph of the parametric function y = a x^k sin(bx)
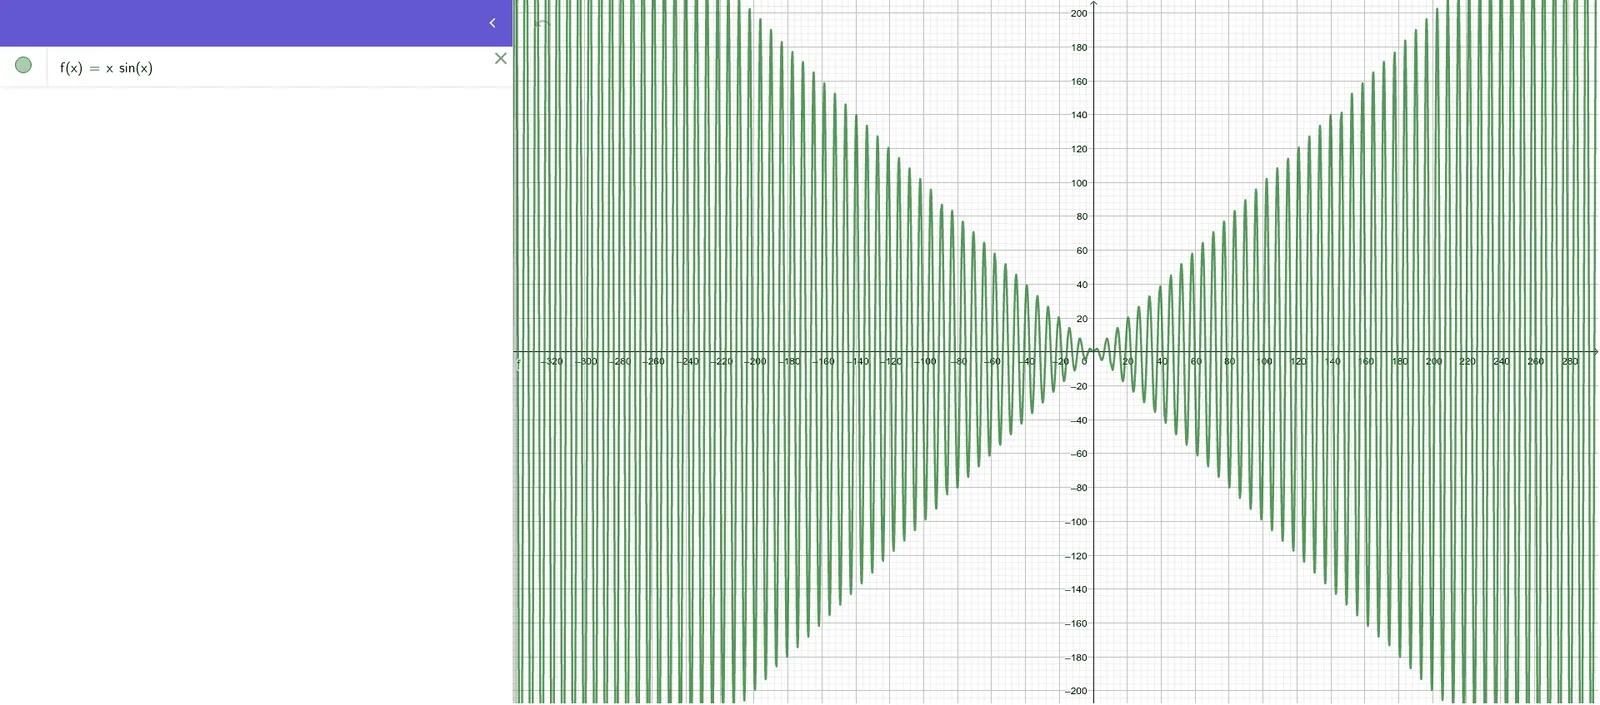
This interactive example demonstrates the graph of the function y = a·xᵏ·sin(bx), where parameters a, b, and k control amplitude, frequency, and power-law modulation. It illustrates how trigonometric oscillations interact with polynomial growth or decay, highlighting concepts in function transformation, parametric dependence, and waveform behavior. Constructed in GeoGebra using three slider objects (a, b, k) and a defined function f(x) = a*x^k*sin(b*x), it enables real-time exploration of parameter effects. Suitable for high school precalculus and introductory college calculus courses, especially when studying composite functions, damped oscillations, or graphical analysis of parametric families.
Loading the math board and drawing, please wait…