
Normal Distribution Z-Score Calculator: Dynamic Visualization
Loading the math board and drawing, please wait…
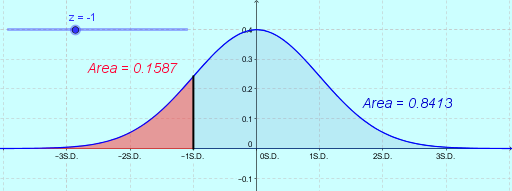
① This GeoGebra example dynamically demonstrates the probability area under the standard normal distribution curve corresponding to a given Z-score, visually showing the relationship between Z-scores and cumulative probabilities. ② Core mathematical concepts include normal distribution, standard normal distribution, Z-score (standard score), probability density function, cumulative distribution function, and integration for area calculation. ③ Construction details: The Integral command computes the area under the normal curve from negative infinity to the Z-value, the Segment command draws the vertical line at the Z-score, the If command controls conditional display, and objects include f (normal distribution function), z (Z-score slider), a (area value), text1 (label), c (curve), S (area region), b (another boundary), and text2 (explanatory text). ④ Suitable for high school and university statistics/probability courses, useful for understanding Z-score conversion, table lookup principles, and normal distribution probability calculations, as well as for classroom demonstrations or student self-exploration.
GeoGebra Commands & Parameters
Integral(f, -10, z) → aSegment((z, 0), (z, f(z))) → cIf(z ≤ 0, (z - 1.8, f(z) - 0.05), (z + 0.3, f(z) - 0.05)) → SIntegral(f, z, 10) → b
AI Drawing Prompt Reference
Draw a standard normal distribution curve with horizontal axis for Z-scores and vertical axis for probability density. Include a draggable slider to adjust the Z-score value. At the current Z-score, draw a vertical dashed line from the horizontal axis up to the curve. Shade the area under the curve from negative infinity to this Z-score in a semi-transparent color, and display its numerical area value. Also shade the area from this Z-score to positive infinity on the other side, showing its area as well. Add text labels near the curve to indicate the relationship between the Z-score and the two shaded probability areas. The visualization aims to show how Z-scores correspond to cumulative probabilities.
The prompt above was compiled from the original drawing commands and is for reference only.