
How to Sketch Piecewise Functions: Random Generation and Interactive Demo
Loading the math board and drawing, please wait…
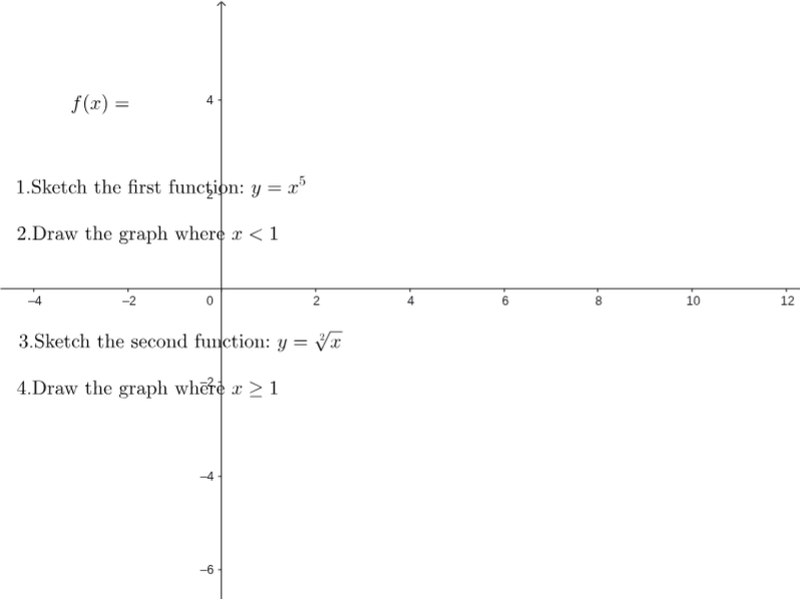
This GeoGebra example demonstrates how to dynamically sketch piecewise functions using random generation and interactive elements. The core mathematical concepts include piecewise function definition, domain segmentation, and different expressions on each interval, along with random number generation and set operations for constructing practice problems. Construction highlights: commands such as RandomElement and Random generate random breakpoints and coefficients; Point and Segment draw key points and line segments; multiple function objects (f1, f2, f3, f4, f5) define each piece; lists (mylist), inequalities (ineql, ineqg), and random pickers (pick1, pick2) control visibility and interactivity. This is suitable for high school or pre-university students learning function graphs and piecewise functions, and for teachers creating randomized exercises or students exploring properties of piecewise functions.
GeoGebra Commands & Parameters
RandomElement(KeepIf[(x ≠ 0) ∧ (x ≥ Max[xmin, ymin]) ∧ (x ≤ Min[xmax, ymax]), Sequence[i, i, (-abs((xmin * ymin))), abs((xmax * ymax)) + If[rs, 0, 0]]]) → numbersectionexamRandomElement(KeepIf[x ≠ 0, Sequence[i, i, -5, 5 + If[rs, 0, 0]]]) → numverSelectionwithExcludingRandomElement(KeepIf[(x ≠ 0) ∧ (x ≠ 1), Sequence[i, i, -7, 7 + If[rs, 0, 0]]]) → nRandom(2, 7 + If[rs, 0, 0]) → mRandomElement(KeepIf[x ≠ 0, Sequence[i, i, -3, 3 + If[rs, 0, 0]]]) → aRandom(-2, 2 + If[rs, 0, 0]) → bRandom(2, Min[abs(xmin), xmax] + If[rs, 0, 0]) → cRandom(1, 5 + If[rs, 0, 0]) → pick1RandomElement(KeepIf[x ≠ pick1, Sequence[i, i, 1, 5 + If[rs, 0, 0]]]) → pick2Random(1, 2 + If[rs, 0, 0]) → r1Random(1, 2 + If[rs, 0, 0]) → r2Random(xmin + 2, xmax - 3 + If[rs, 0, 0]) → rn1Random(rn1 + 1, xmax - 1 + If[rs, 0, 0]) → rn2Point(xAxis) → APoint(xAxis) → AoSegment((x(Corner[1]), 0), If[d, Ao, A]) → fPoint(xAxis) → BoPoint(xAxis) → BSegment(If[h, Bo, B], (x(Corner[2]), 0)) → g
AI Drawing Prompt Reference
Create a piecewise function graph with randomly generated breakpoints and expressions. Divide the x-axis into three intervals using two movable points, and draw a distinct curve for each segment: one constant, one linear, and one quadratic. Show the domain ranges for each piece, and include interactive sliders or points to adjust the boundaries. Use a clean grid background with labeled axes, and ensure the curves are smooth and visually distinct.
The prompt above was compiled from the original drawing commands and is for reference only.