
Graphing Linear Equations in Slope-Intercept/Standard Form Practice
Loading the math board and drawing, please wait…
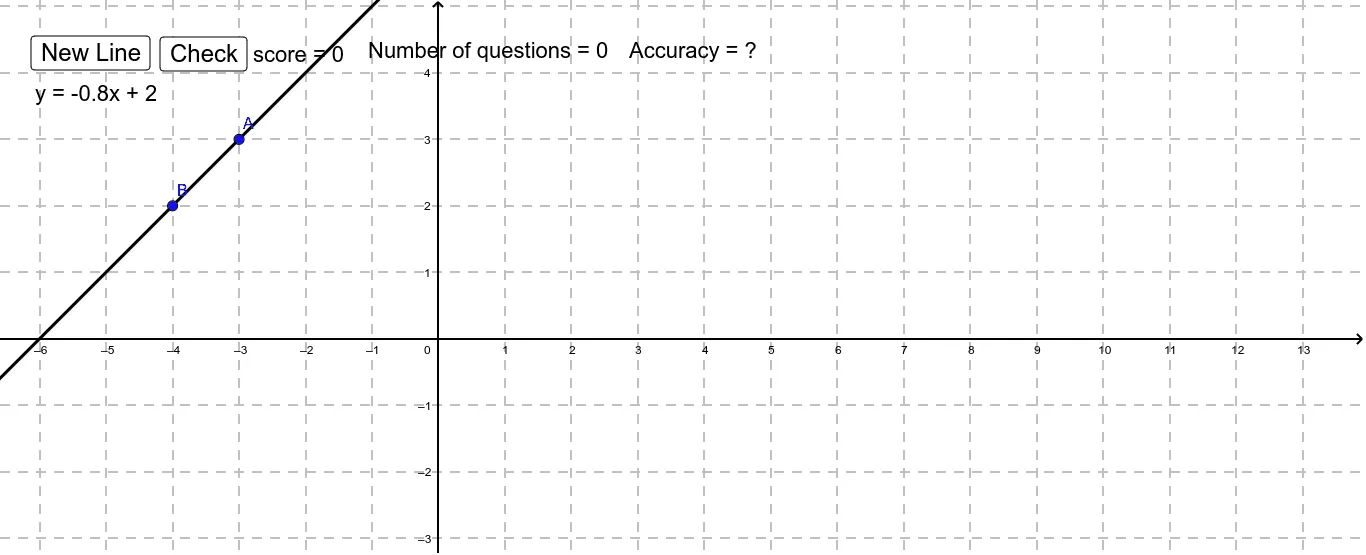
① This GeoGebra example demonstrates an interactive drill for graphing linear equations in slope-intercept (y=mx+b) and standard form (Ax+By=C), where students must determine whether a randomly generated line matches the given equation. ② Core math concepts include linear equations, slope, y-intercept, standard form conversion, and the visual representation of lines on a coordinate plane. ③ Construction details: the Line command draws the graph, RandomElement and Random generate random slope and intercept values, Text displays the problem and feedback, buttons (button1/button2) allow answer submission and checking, sameline1/sameline2 verify if two lines coincide, and score/accu track accuracy while problems/questions count attempts. ④ Suitable for middle school to high school students learning linear equations, ideal for classroom practice or self-study, providing immediate feedback to reinforce the connection between algebraic forms and graphical representations.
GeoGebra Commands & Parameters
Line(A, B) → aRandomElement({-4, -3, -2.5, -2, -1.5, -1, -0.8, -0.75, -0.6, -0.5, -0.4, -0.25, -0.2, 0.2, 0.25, 0.4, 0.5, 0.6, 0.75, 0.8, 1, 1.5, 2, 2.5, 3, 4}) → mRandom(-5, 5) → bRandomElement({1, 2}) → rText(("score = " * score)) → text1Text(l1) → text2Text(l2) → text3Text(("Number of questions = " * problems)) → questionsText(("Accuracy = " * accu)) → accur
AI Drawing Prompt Reference
Draw a line with a slope m randomly selected from -4 to 4 and a y-intercept b randomly selected from -5 to 5. Convert the line equation to standard form Ax+By=C. Set up a scoreboard to display the score, number of questions, and accuracy. Provide two buttons for submitting answers and checking if the lines coincide.
The prompt above was compiled from the original drawing commands and is for reference only.