
Visualizing a System of Linear Equations: Intersection of Two Lines by Alan Chan
Loading the math board and drawing, please wait…
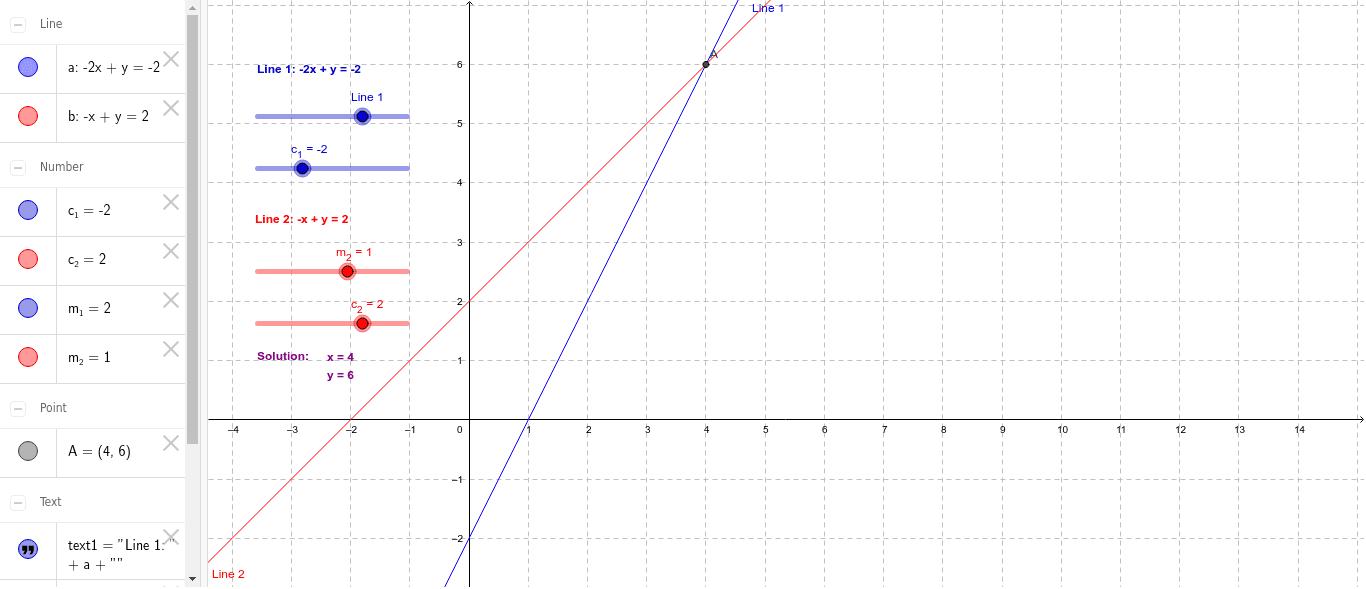
① This example dynamically demonstrates how the solution of a system of two linear equations (the intersection point of two lines) changes as the slopes and intercepts are adjusted. ② Core mathematical concepts include linear equations, slope-intercept form (y = mx + c), systems of equations, intersection points, and parametric effects on solutions. ③ Construction: Using GeoGebra commands Line and Intersect, two lines are created with parameters m_1, c_1, m_2, c_2; the intersection point A is computed, and text objects (text1–text4) display the equations and solution. Sliders (a, b) likely control parameter values. ④ Suitable for middle and high school students learning algebra and coordinate geometry, as well as teachers for classroom demonstrations, helping visualize unique, no, or infinite solutions from a geometric perspective.
GeoGebra Commands & Parameters
Line((0, c_1), (1, m_1 + c_1)) → aLine((0, c_2), (1, m_2 + c_2)) → bIntersect(a, b) → A
AI Drawing Prompt Reference
Draw two lines with slope m_1 and y-intercept c_1, and another with slope m_2 and y-intercept c_2. Adjust m_1, c_1, m_2, and c_2 to see how the intersection point changes. Display the equations of the two lines and the coordinates of the intersection point below the graph.
The prompt above was compiled from the original drawing commands and is for reference only.