
Visualizing Triangle Inequalities by Alan Chan
Loading the math board and drawing, please wait…
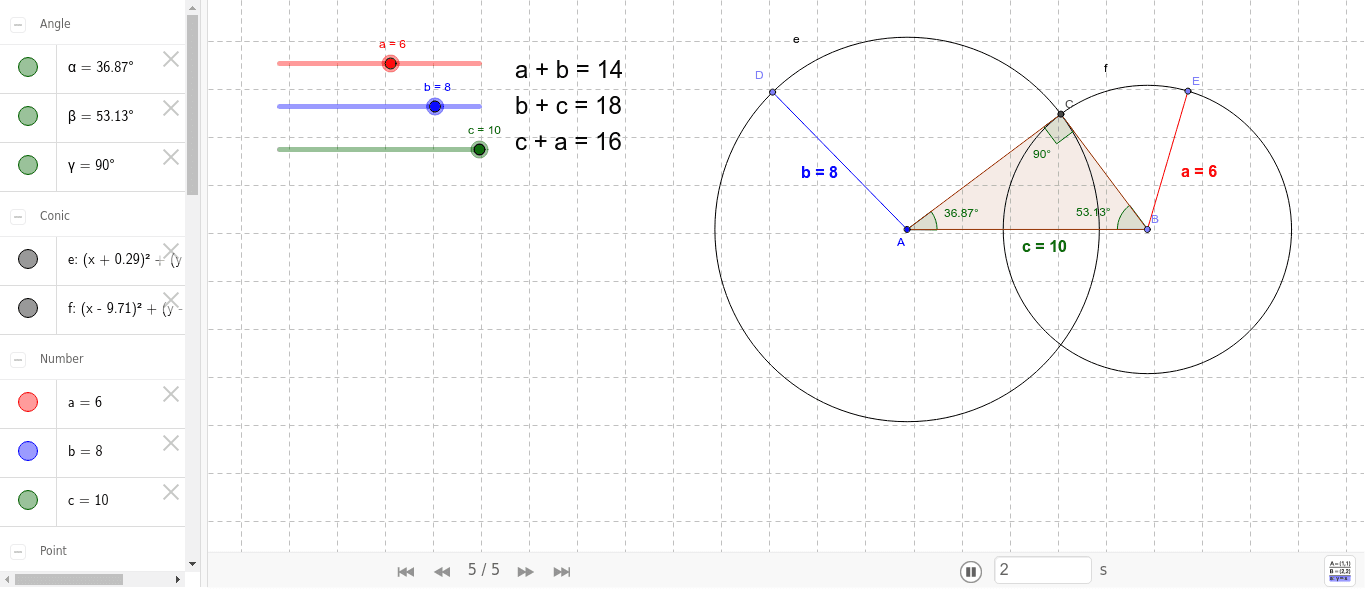
This example demonstrates the principle of triangle inequalities using GeoGebra, showing the relationship between side lengths of a triangle. Key mathematical concepts include inequalities, geometric symmetry, and intersection points. Construction involves commands like Point, Segment, Circle, Intersect, and objects such as A, B, C, d, e, f. Suitable for middle school students learning geometry and inequality applications.
GeoGebra Commands & Parameters
Point(Circle[A, abs(c)]) → BSegment(A, B) → dCircle(A, b) → eCircle(B, a) → fIntersect(e, f, 1) → CPolygon(A, B, C) → poly1, c_1, a_1, b_1Angle(poly1) → α, β, γPoint(e) → DPoint(f) → ESegment(A, D) → gSegment(B, E) → hMidpoint(g) → FMidpoint(h) → GMidpoint(c_1) → H
AI Drawing Prompt Reference
Draw a triangle ABC satisfying the triangle inequality. Start by picking point B on circle A, then draw segment AB as d. Draw circle e with center A and radius b, and circle f with center B and radius a. The intersection of circles e and f gives point C. Connect points A, B, and C to form triangle ABC and label its angles α, β, and γ. Draw segments AD and BE, where D and E are points on circles e and f respectively, and F and G are the midpoints of AD and BE, while H is the midpoint of BC.
The prompt above was compiled from the original drawing commands and is for reference only.