
Graphical Method for Solving Polynomial Inequalities
Loading the math board and drawing, please wait…
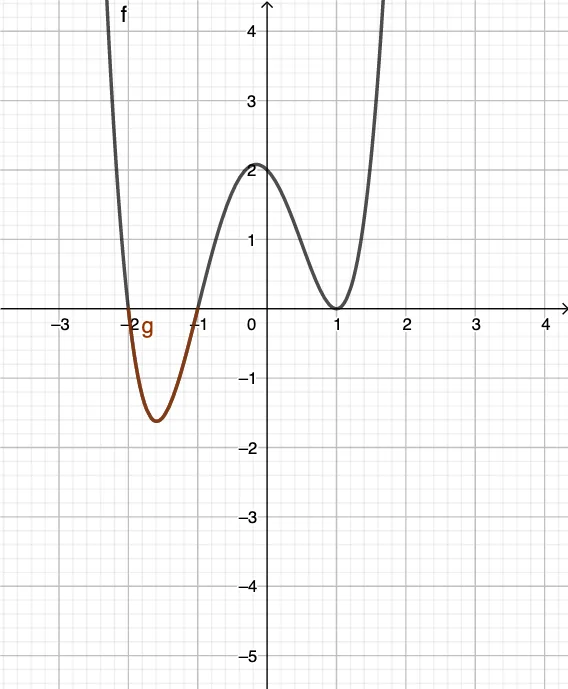
This example demonstrates how to solve one-variable polynomial inequalities by graphing. By plotting a polynomial function and visually comparing it to the x-axis, learners can determine where the inequality holds (e.g., f(x) > 0 or f(x) ≤ 0) and read the solution intervals directly from the graph. The key mathematical ideas include polynomial functions, roots/zeros, sign analysis, and interpreting inequalities using graph positions relative to the x-axis. Construction-wise, the GeoGebra setup uses function-related objects such as f and g: f represents the polynomial, while g is used to display the corresponding graph and support the reading of critical points. The solution is obtained by locating x-intercepts (where f crosses or touches the x-axis) and then determining the sign of the function on each interval separated by these roots. Suitable for high-school to pre-college students, it supports classroom visualization and self-study of inequality-solving techniques via graphing.
GeoGebra Commands & Parameters
f: y = x^(4) + x^(3) - (3 * x^(2)) - x + 2g(x) = If[f(x) < 0, f(x)]
AI Drawing Prompt Reference
Draw the graph of a quartic polynomial function and highlight the region where the function is below the x-axis. First, plot the entire quartic polynomial function, then shade or color the area below the x-axis where the function's value is negative, to visualize the intervals where the function changes sign and understand the solution to polynomial inequalities.
The prompt above was compiled from the original drawing commands and is for reference only.