
Dynamic Histogram - Babies' Weight Distribution
Loading the math board and drawing, please wait…
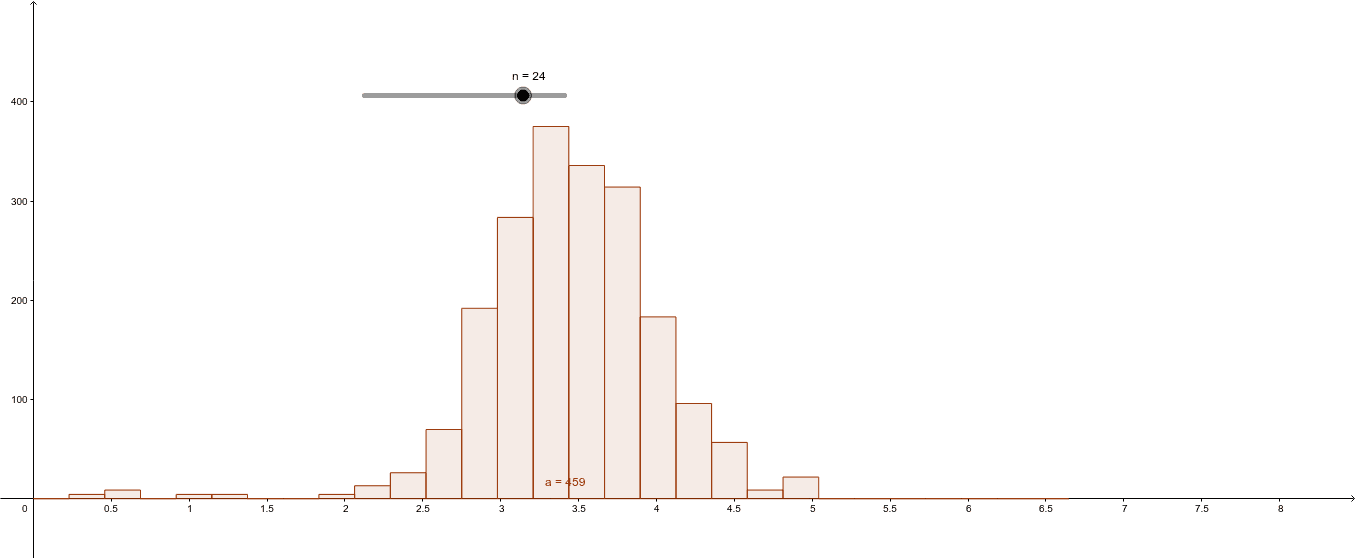
① This example demonstrates a dynamic histogram that visualizes the frequency distribution of a set of babies' weight data, allowing users to adjust bin widths or data ranges to observe changes in the histogram shape. ② The core mathematical concepts are frequency distribution and histograms in statistics, involving data binning, frequency counting, and visual representation of distribution shapes. ③ Construction highlights: The GeoGebra Histogram command is used with 40 data points (A1 to A40) representing baby weights; sliders or dynamic parameters control the bin intervals, enabling interactive exploration. ④ Suitable for introductory statistics courses in middle school, high school, or college, this example helps students understand data distributions, compare the effects of different binning choices, and serves as a classroom demonstration or self-study tool for probability and statistics.
GeoGebra Commands & Parameters
Histogram(list2, list1, true, 1) → a
AI Drawing Prompt Reference
Create a dynamic histogram to visualize the frequency distribution of a set of baby weights using 40 data points, with sliders or dynamic parameters to control the bin intervals for observing changes in the histogram shape when adjusting the bin widths or data ranges, suitable for introductory statistics courses as a teaching demonstration or self-study tool.
The prompt above was compiled from the original drawing commands and is for reference only.