
Approximation of Binomial, Poisson, and Normal Distributions
Loading the math board and drawing, please wait…
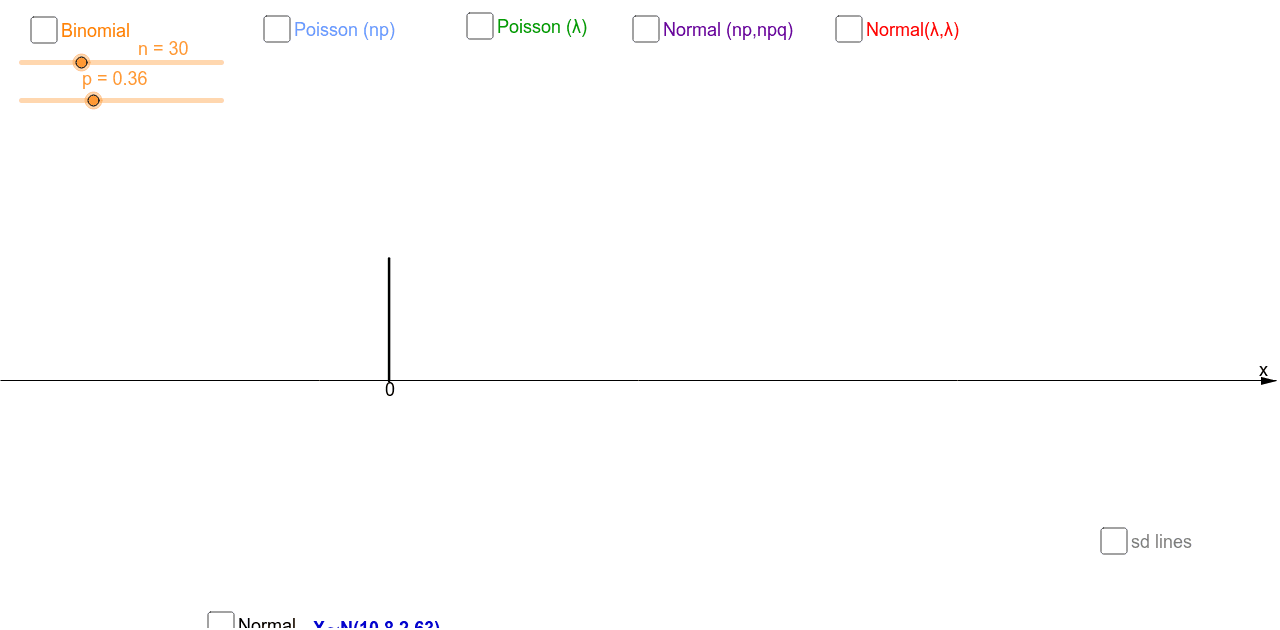
This interactive GeoGebra app demonstrates the approximation relationships among the binomial (B), Poisson (Po), and normal (N) distributions. It visually shows how a binomial distribution can be approximated by a Poisson distribution when n is large and p is small, and by a normal distribution when n is large and p is not too extreme; it also shows the normal approximation to the Poisson distribution for large λ. The core mathematical concepts include discrete probability distributions (binomial and Poisson), continuous normal distribution, expected value, variance, standard deviation, and the limiting theorems (Poisson theorem and central limit theorem). The construction uses GeoGebra commands such as BinomialDist, Poisson, Normal, and Segment, with sliders to adjust parameters n, p, and λ, and text objects to display np and npq. This app is suitable for high school or undergraduate statistics courses, serving as a visual aid for teaching distribution approximations and as a tool for exploratory data analysis.
GeoGebra Commands & Parameters
BinomialDist(n, p) → BinomialNormal(np, ((np * (1 - p)))^(0.5), x) → fSegment((np, 0), (np, 0.15)) → dSegment((0, 0), (0, 0.15)) → ePoisson(λ) → PoissonPoisson(np) → gNormal(np, sqrt(npq), x) → hSegment((np - sqrt(npq), 0), (np - sqrt(npq), 0.2)) → kSegment((np + sqrt(npq), 0), (np + sqrt(npq), 0.2)) → lSegment((np - (2 * sqrt(npq)), 0), (np - (2 * sqrt(npq)), 0.2)) → rSegment((np + (2 * sqrt(npq)), 0), (np + (2 * sqrt(npq)), 0.2)) → sNormal(λ, sqrt(λ), x) → t
AI Drawing Prompt Reference
Create an interactive graph illustrating the approximation relationships among binomial, Poisson, and normal distributions. Plot the binomial distribution as discrete points, the Poisson distribution as discrete points, and the normal distribution as a continuous curve. Include sliders to adjust the binomial parameters n and p, and the Poisson parameter λ. Display the values of np and npq. Add vertical line segments at the mean and at one and two standard deviations from the mean for the normal approximations. Arrange the graph to clearly show that the binomial approaches Poisson when n is large and p is small, and approaches normal when n is large and p is moderate, while Poisson approaches normal for large λ.
The prompt above was compiled from the original drawing commands and is for reference only.