
Visualizing the Derivative of a Function: Tangent Slope in Action
Loading the math board and drawing, please wait…
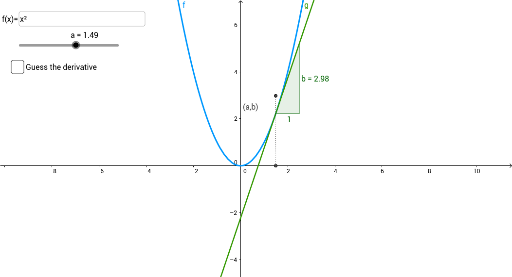
① This example dynamically illustrates the derivative of a function by showing the tangent line at a movable point and its slope, making the concept of instantaneous rate of change visually intuitive. ② Core mathematical concepts include the derivative as the slope of the tangent line, the limit definition of the derivative, and local linear approximation. ③ Construction details: Using GeoGebra commands such as Textfield for input boxes, Tangent to create the tangent line, Slope to compute its slope, OrthogonalLine for perpendiculars, Intersect for intersection points, and Segment for line segments, along with sliders (a) and input boxes (d) to adjust the point and function parameters interactively. ④ Suitable for high school and introductory college calculus students, this tool helps learners grasp the transition from secant to tangent lines and the geometric meaning of the derivative, and serves as an effective classroom demonstration for teachers.
GeoGebra Commands & Parameters
Textfield(f) → InputBox1Tangent(A, f) → gSlope(g) → bOrthogonalLine(B, xAxis) → hIntersect(h, xAxis) → CSegment(B, C) → iSegment(C, B) → jTextfield(p) → InputBox2