
Average Rate of Change: Graph a Function (1)
Loading the math board and drawing, please wait…
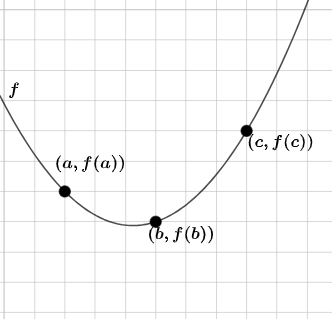
This interactive GeoGebra example demonstrates the concept of average rate of change for a function over an interval, showing how the slope of the secant line changes as the interval endpoints move. Core mathematical concepts include average rate of change, secant line slope, and their geometric interpretation on a function graph. Construction highlights: the PointIn command places points on the function curve, FitPoly fits a polynomial, Line constructs the secant, Random generates random values, Sequence creates point lists, FractionText displays the slope as a fraction, and If checks correctness, with buttons and text boxes providing interactive feedback. Suitable for high school or pre-calculus students learning rates of change and an introduction to derivatives, as well as for classroom demonstrations or self-paced exploration.
GeoGebra Commands & Parameters
PointIn(a) → BPointIn(b) → CFitPoly({A, B, C}) → fLine(A, B) → gLine(A, C) → hLine(B, C) → iRandom(1, 3) → cSequence(i, i, -9, 9, 1) → nlistFractionText(d) → text1If(c ≟ 1, text3, c ≟ 2, text4, c ≟ 3, text3) → firstIf(c ≟ 1, text4, c ≟ 2, text5, c ≟ 3, text5) → second
AI Drawing Prompt Reference
Create an interactive mathematical visualization demonstrating average rate of change on a function graph. Show a smooth curve representing a function in a coordinate system, with two movable points on the curve serving as interval endpoints. Draw a secant line connecting these two points, and display the slope of this secant line as a fraction in the graphic. Include a third reference point on the curve that can form alternative secant lines. Present randomly generated comparison cases with text boxes showing different slope results. The visualization allows dragging the endpoints to dynamically show how the secant slope changes with the interval, illustrating the relationship between average rate of change and the derivative concept.
The prompt above was compiled from the original drawing commands and is for reference only.