
Level Curves and Surfaces: Visualizing 3D Functions
Loading the math board and drawing, please wait…
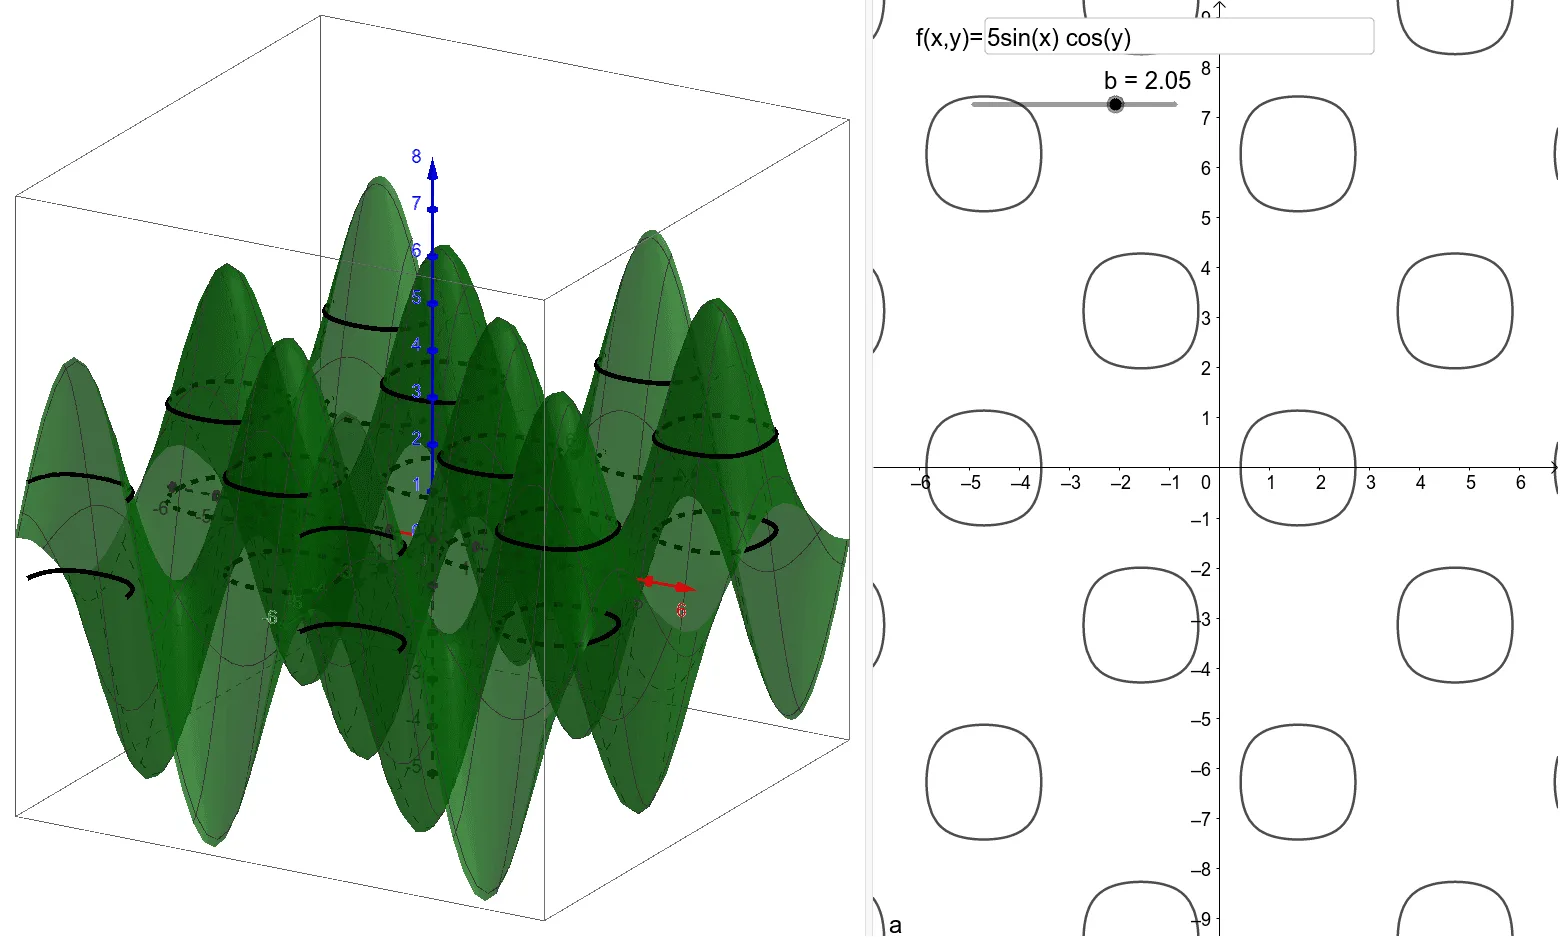
This GeoGebra example dynamically illustrates the relationship between level curves (contour lines) of a two-variable function and its corresponding 3D surface. It demonstrates how horizontal slices of a surface project onto the xy-plane as level sets, revealing the function's variation. Core mathematical concepts include level sets, contour lines, surfaces, and projections in multivariable calculus. The construction uses a Textfield for interactive input, a Plane object to create horizontal cutting planes, and the IntersectPath command to compute the intersection curves between the plane and the surface, generating the level curves. Key objects include the function f, parameters a and b, point A, and InputBox2, allowing dynamic adjustment of parameters to observe how the surface and its contours change together. This resource is suitable for high school to university-level mathematics education, particularly for introducing multivariable calculus and spatial analytic geometry, and serves well for classroom demonstrations or self-directed exploration of function shapes.
GeoGebra Commands & Parameters
Textfield(f) → InputBox2Plane(A, xOyPlane) → cIntersectPath(c, f) → d
AI Drawing Prompt Reference
Visualize a 3D function by showing its level curves projected onto the xy-plane, with dynamic adjustments to observe changes in both the surface and the contours. Start by creating a text field with an input box for the function expression. Then, generate a plane passing through a specified point, parallel to the xy-plane. Finally, compute the intersection curve between this plane and the function graph to obtain the level curves, displaying them on the xy-plane.
The prompt above was compiled from the original drawing commands and is for reference only.