
Function vs Derivative: Dynamic Comparison
Loading the math board and drawing, please wait…
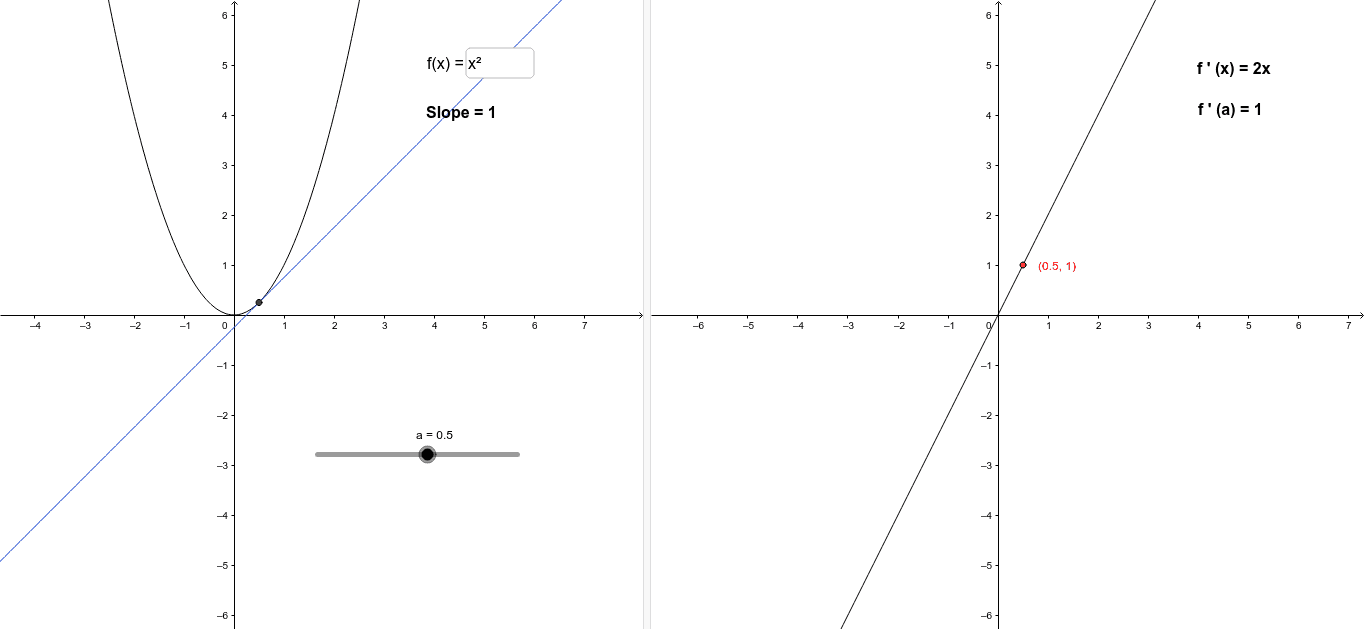
① This GeoGebra example dynamically displays a function f and its derivative g, allowing users to visually compare the original function with its rate of change. ② Core mathematical concepts include derivatives (differential calculus), function graphing, and the relationship between a function and its derivative. ③ Construction highlights: a Textfield (inputBox1) lets users input a custom function f; the Derivative command generates g; points A, B and text objects (text1, text2, text3) are used for annotations or value displays; additional elements like ellipse, hyperbola, and trapezoid may be present but the main focus is the function-derivative pair. ④ Suitable for high school to early college calculus courses, this interactive tool helps students grasp the geometric meaning of derivatives (slope of tangent) and explore how different functions (polynomials, trigonometric, etc.) behave under differentiation.
GeoGebra Commands & Parameters
Textfield(f) → inputBox1Derivative(f) → g
AI Drawing Prompt Reference
Create a dynamic visualization showing a function and its derivative, allowing users to input a custom function which displays both the original function and its derivative in different colors. Mark several points on the function graph and show their function values and derivative values, with text annotations explaining the relationship between the function and its derivative, and how the derivative represents the slope of the tangent line.
The prompt above was compiled from the original drawing commands and is for reference only.