
Mixed Numbers Visualization: Pie Charts and Sequence Construction
Loading the math board and drawing, please wait…
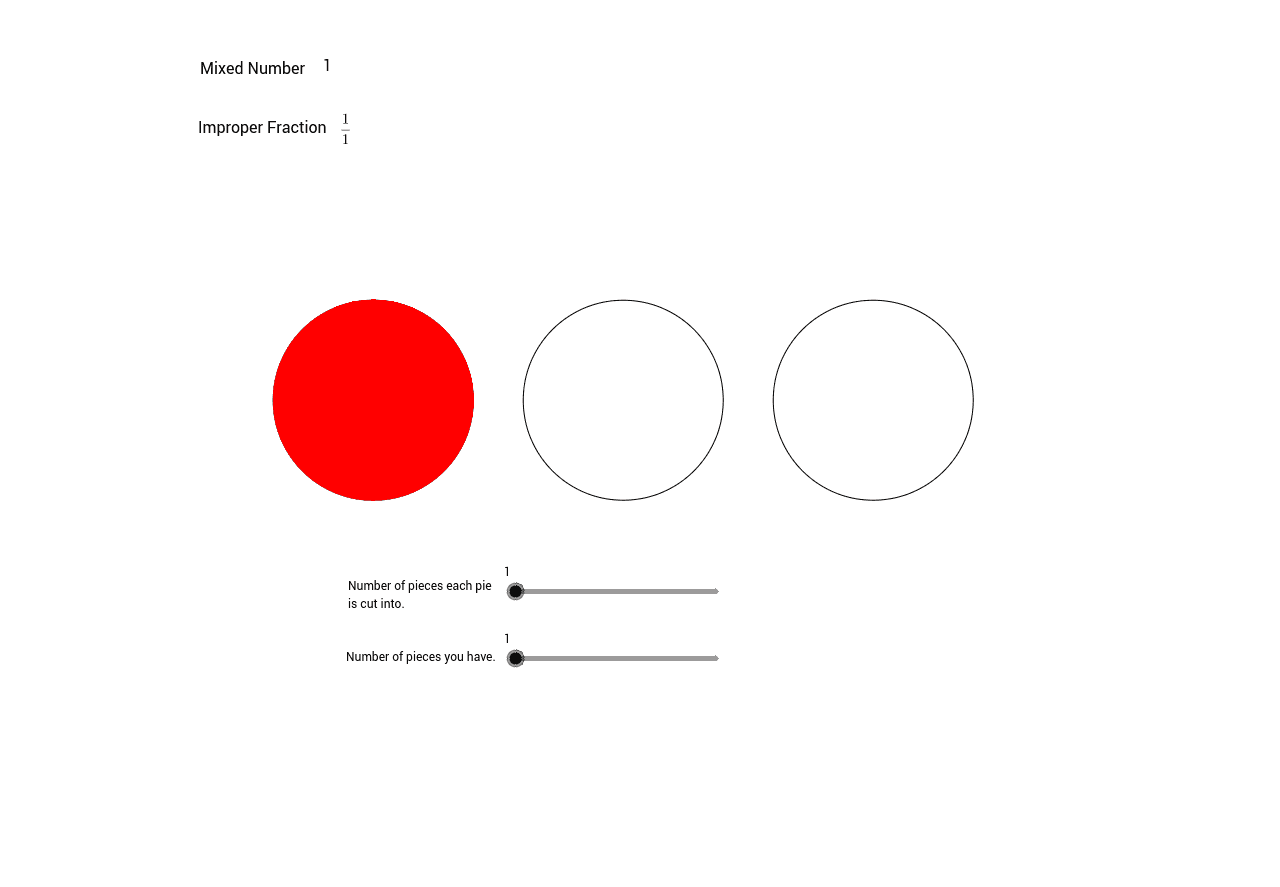
① This example demonstrates mixed numbers (e.g., integer plus proper fraction) using multiple pie-chart sectors and sequenced points, turning abstract numerical concepts into visual area divisions. ② Core math concepts include the meaning of mixed numbers, combination of integers and fractions, and understanding part-whole relationships via sector area proportions, along with using sequences to generate repeated structures. ③ Construction highlights: GeoGebra commands include Intersect, Circle, Point, Sequence, and Sector; objects include A, B, c, C, D, d, E, F, e, a, list1, list2, list3, b, f, G, H, g, h, i, k, j, plus numerous text labels (text1 to text11) and pie objects (pie2, pie3), combining sectors to represent different mixed numbers. ④ Suitable for upper elementary to middle school students learning fractions and mixed numbers, and for teachers creating interactive lessons to connect fraction arithmetic with geometric intuition.
GeoGebra Commands & Parameters
Intersect(xAxis, yAxis) → ACircle(A, B) → cPoint(xAxis) → CPoint(xAxis) → DCircle(C, D) → dPoint(xAxis) → EPoint(xAxis) → FCircle(E, F) → eSequence(Segment[((2 * cos(((2 * π / a) * n))), (2 * sin(((2 * π / a) * n)))), (0, 0)], n, 1, a) → list1Sequence(Segment[((2 * cos(((2 * π / a) * n))) - 5, (2 * sin(((2 * π / a) * n)))), (-5, 0)], n, 1, a) → list2Sequence(Segment[((2 * cos(((2 * π / a) * n))) + 5, (2 * sin(((2 * π / a) * n)))), (5, 0)], n, 1, a) → list3Sector(d, (-3, 0), ((2 * cos(((b * 2) * π / a))) - 5, (2 * sin(((b * 2) * π / a))))) → fPoint(list2) → GPoint(list2) → HSector(c, (2, 0), ((2 * cos(((b * 2) * π / a))), (2 * sin(((b * 2) * π / a))))) → hSector(e, (7, 0), ((2 * cos(((b * 2) * π / a))) + 5, (2 * sin(((b * 2) * π / a))))) → k
AI Drawing Prompt Reference
Draw three pie charts arranged horizontally, each representing a mixed number. The left chart has its center at the origin with radius 2, divided into equal sectors by radial segments, with one sector filled to show the whole part. The middle chart is centered at (-5,0) and the right at (5,0), each similarly divided and partially filled. Below each chart, place a horizontal axis with marked points. The overall composition visualizes how integers and proper fractions combine, with sector areas indicating fractional proportions.
The prompt above was compiled from the original drawing commands and is for reference only.