
Approximating the Area Under a Curve: Rectangle and Trapezoidal Sums
Loading the math board and drawing, please wait…
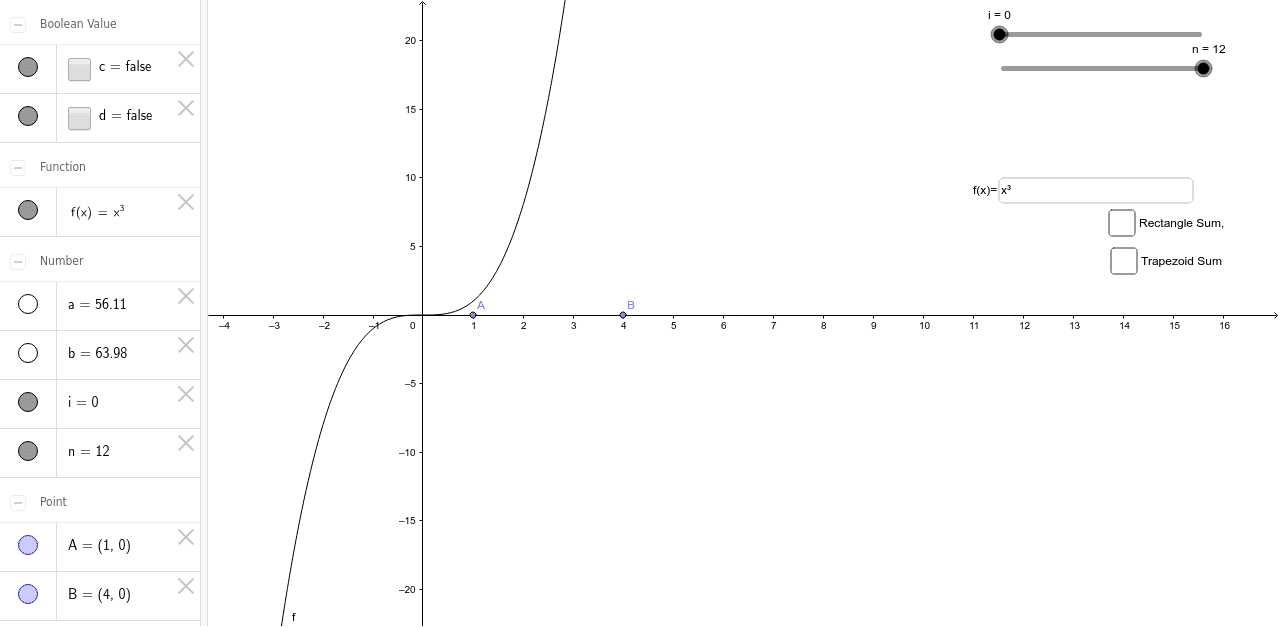
① This interactive GeoGebra example demonstrates how to approximate the area under a curve using rectangle sums and trapezoidal sums, visualizing the geometric meaning of definite integrals. ② Core mathematical concepts include definite integrals, Riemann sums, left/right/midpoint rectangle methods, and the trapezoidal rule, along with the convergence of approximations as the number of partitions increases. ③ Construction highlights: using GeoGebra commands such as Point to define points on the curve, RectangleSum and TrapezoidalSum to generate the sums, and Textfield with an input box (inputBox1) to adjust the number of subintervals n. Objects include the function f, interval endpoints a and b, and variable n, allowing dynamic updates of the approximation. ④ Suitable for high school seniors or early college calculus students to grasp the definition of the integral and numerical integration techniques, and useful for classroom demonstrations by teachers.
GeoGebra Commands & Parameters
Point(xAxis) → APoint(xAxis) → BRectangleSum(f, x(A), x(B), n, i) → aTrapezoidalSum(f, x(A), x(B), n) → bTextfield(f) → inputBox1
AI Drawing Prompt Reference
Draw a function curve and approximate the area under it using rectangles and trapezoids. Place two movable points on the x-axis to define the interval endpoints. Include an input box to adjust the number of subintervals. As the number changes, the rectangles and trapezoids update, showing how the approximation approaches the true area. The graph should show the curve, axes, interval endpoints, rectangle and trapezoid shapes, and a control for the partition count.
The prompt above was compiled from the original drawing commands and is for reference only.