
Exponential and Gompertz Function Graphing
Loading the math board and drawing, please wait…
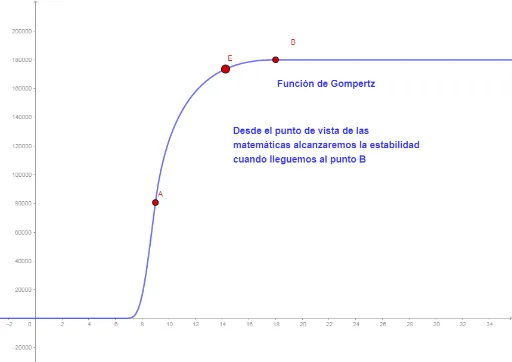
This example demonstrates the graphing of exponential and Gompertz functions, showcasing their behavior and transformations. Key mathematical concepts include function graphs, limits, integral calculus, translations, and confidence intervals. The construction utilizes GeoGebra commands like CurveCartesian for plotting curves and Point objects, along with parameters such as b_1, c_1, a_1, a, k, f, and others for dynamic control and labeling. Suitable for high school and advanced mathematics education, this example aids in understanding function analysis, calculus concepts, and parameter manipulation.
GeoGebra Commands & Parameters
CurveCartesian(((1 - t)^(3) * A) + (((3 * (1 - t)^(2)) * t) * C) + (((3 * (1 - t)) * t^(2)) * D) + (t^(3) * B), t, 0, 1) → iPoint(i) → E
AI Drawing Prompt Reference
Graph exponential and Gompertz functions to display their shapes and transformations, including function curves and points, with parameters controlling dynamic changes, and label key mathematical concepts like limits, integrals, translations, and confidence intervals, first plot the curve then mark key points.
The prompt above was compiled from the original drawing commands and is for reference only.