
Limits of Rational Functions Practice
Loading the math board and drawing, please wait…
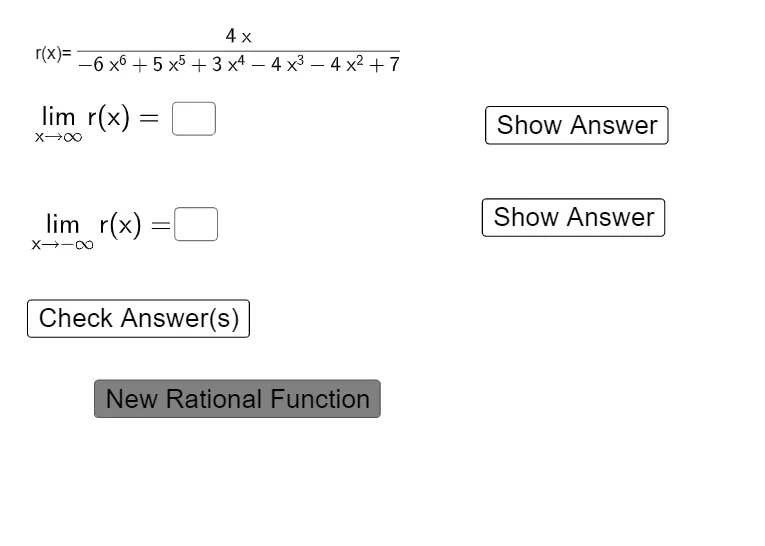
This example demonstrates how to graph rational functions and analyze their end behavior at infinity using GeoGebra. Key math concepts include rational functions, limits, asymptotes, and polynomial division. It utilizes commands like Random, Sequence, Expand, Limit, Textfield, and FractionText for interactive exploration and visualization, making it suitable for high school and college students learning calculus and function limits.
GeoGebra Commands & Parameters
Random(1, 7) → dnRandom(1, 7) → ddSequence(Random[-7, 7], k, 0, dn) → cnSequence(Random[-7, 7], k, 0, dd) → cdExpand(Simplify[Sum[(cn(i) * x^(i - 1)), i, 1, Length[cn]]]) → fExpand(Simplify[Sum[(cd(i) * x^(i - 1)), i, 1, Length[cd]]]) → gLimit(r, Infinity) → limLimit(r, -Infinity) → nlimTextfield(l) → InputBox1Textfield(nl) → InputBox2FractionText(l) → AFractionText(lim) → BFractionText(nl) → CFractionText(nlim) → D
AI Drawing Prompt Reference
Graph a rational function with randomly generated numerator and denominator coefficients, showing its limit behavior at infinity. Expand the polynomials to get the function, and label the limits at positive and negative infinity. Include text boxes for inputting coefficients and display the limit values as fractions.
The prompt above was compiled from the original drawing commands and is for reference only.