
Function Limits
Loading the math board and drawing, please wait…
In collections
数式処理(CAS) を学ぶ
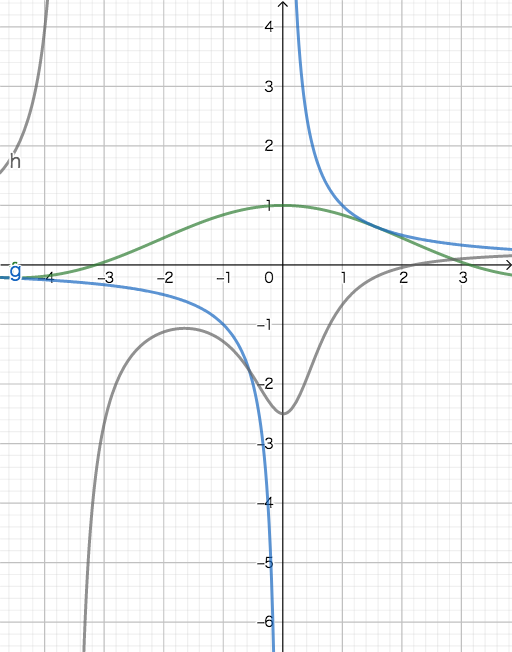
This example demonstrates the limit behavior of functions at specific points, intuitively showing how function values change as the independent variable approaches a certain point. Core mathematical concepts include the definition of function limits, left-hand and right-hand limits, and conditions for limit existence. Construction: Use GeoGebra to plot functions f(x), g(x), and h(x), observe function values approaching different points to understand limits, and dynamically demonstrate the approaching process with sliders. Suitable for high school or early college students learning calculus concepts, serving as an effective visualization tool for introductory calculus studies.
GeoGebra Commands & Parameters
sin(x) / xLimit(f, 0)1 / xLimitBelow(g, 0)LimitAbove(g, 0)(x^(3) + (2 * x) - 15) / ((3 * x^(3)) + (10 * x^(2)) - x + 6)Limit(h, Infinity)
AI Drawing Prompt Reference
Create a graph illustrating function limits with three curves: the first is sin(x)/x showing the limit approaching 1 as x nears 0; the second is 1/x demonstrating left-hand limit to negative infinity and right-hand limit to positive infinity at x=0; the third is a rational function (x^3+2x-15)/(3x^3+10x^2-x+6) showing the limit as x goes to infinity. Include sliders to dynamically move x toward the target points, and mark the limit values, one-sided limits, and points where limits do not exist.
The prompt above was compiled from the original drawing commands and is for reference only.