
Rational Function Graphing
Loading the math board and drawing, please wait…
In collections
数式処理(CAS) を学ぶ
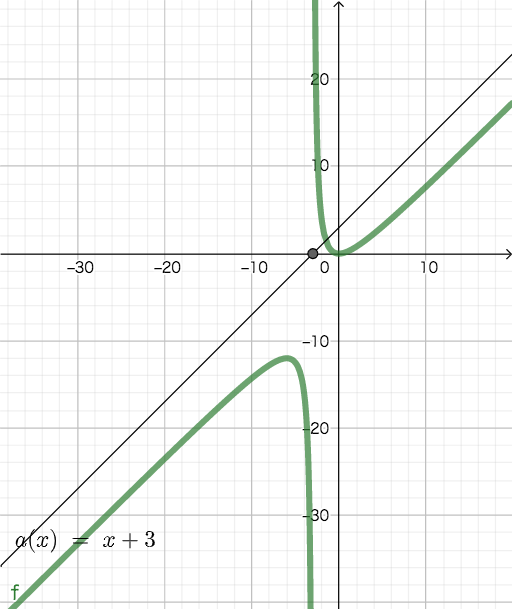
This example demonstrates how to graph rational functions and their key features such as asymptotes and extrema. Core math concepts include function plotting, asymptotic behavior, and critical points. Construction involves GeoGebra commands like f, g, a, and locus追踪 ¥¦§¨©ª_{1} to ¥¦§¨©ª_{5}. Suitable for high school mathematics education and analysis purposes.
GeoGebra Commands & Parameters
(x^(3) + (3 * x^(2))) / (x^(2) + (6 * x) + 9)Root(f)Denominator(f)Denominator(f)Root(Denominator(f))Limit(f, -Infinity)Limit(f, Infinity)LimitBelow(f, -3)LimitAbove(f, -3)
AI Drawing Prompt Reference
Plot the rational function f(x) = (x^3 + 3x^2)/(x^2 + 6x + 9) on the same coordinate plane. Identify the root(s) of the denominator and relate those x-value(s) to the key features of the graph. Then indicate the asymptotic behavior by marking the limits of f(x) as x approaches negative infinity and positive infinity. Finally, focus on x = −3 by showing the left-hand and right-hand limiting values (below/above at that x). Construct in the order: define the function, determine the denominator root(s), then add the limit information.
The prompt above was compiled from the original drawing commands and is for reference only.