
Visualizing Derivatives of Power Functions: Tangent Approximation to a Rule
Loading the math board and drawing, please wait…
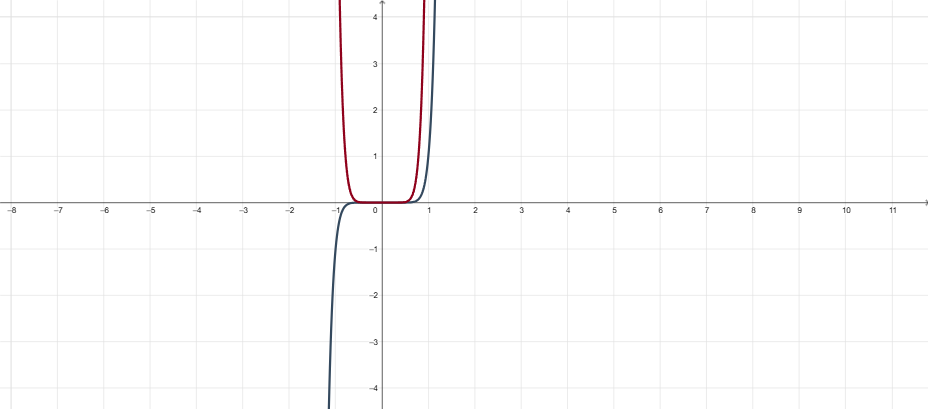
This example demonstrates how the derivative of a power function can be visualized using a geometric/tangent-approximation setup, emphasizing the idea of turning an increment-based difference behavior into an instantaneous slope (limit intuition). It centers on calculus concepts such as derivative as a local rate of change, the derivative definition mindset, and the power rule for f(x)=x^n, along with parameter-driven arithmetic operations. The construction uses GeoGebra’s LaTeX command for mathematical labels and a set of constructed objects and parameters (a, h, k, b, n, g, f, and multiple text objects like text1/text2/text3/text4) to build the relevant points and show the geometric relationship behind the tangent/approximation. It is suitable for upper secondary to early university calculus, supporting teaching, explanation, and interactive exploration of derivative behavior for different exponents.
GeoGebra Commands & Parameters
LaTeX(f) → text3LaTeX(p) → text4
AI Drawing Prompt Reference
Draw a visualization of the derivative of a power function f(x)=x^n, showing the tangent line approximation at a specific point on the curve. The graph should include the curve of the power function, the tangent line at a chosen point, the coordinates of the point of tangency, and the expression for the slope of the tangent line. Start by drawing the curve of the power function, then draw the tangent line at a chosen point on the curve, and label the coordinates of the point of tangency and the expression for the slope of the tangent line.
The prompt above was compiled from the original drawing commands and is for reference only.