
Derivatives of x^n: From Function to Slope
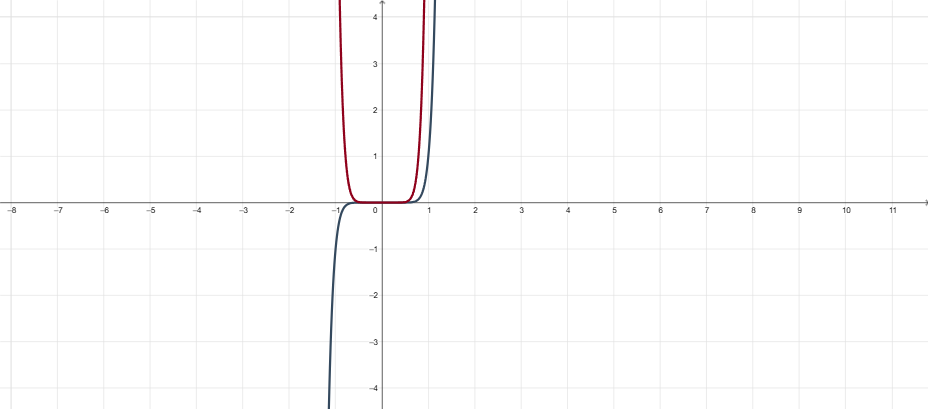
Loading the math board and drawing, please wait…
This example visualizes how the derivative of the power function y = x^n changes with x, showing an explicit geometric link between the original graph and the derivative-related behavior (e.g., how slopes evolve across the domain). Key concepts include the power rule for derivatives (d/dx(x^n)=n·x^{n-1}), the interpretation of a derivative as a rate of change, and graph transformations such as scaling/dilation effects. In GeoGebra, construction is supported by LaTeX typesetting for formulas and labels; objects include parameters like a, h, k, b, n, g, the function object f, and multiple text items (text1–text4) to guide interpretation. The scene also uses objects such as reflect and p to perform or illustrate geometric positioning/symmetry aspects that help relate derivative features back to the original function. Suitable for calculus introduction, derivative teaching, and graph-based understanding for high school advanced or early college learners.
GeoGebra Commands & Parameters
LaTeX(f) → text3LaTeX(p) → text4
AI Drawing Prompt Reference
Draw a coordinate plane with a power function curve y = x^n, where n is adjustable. Select a point on the curve, show its tangent line, and represent the derivative value as a slope segment. Also plot the derivative curve y = n·x^(n-1) to illustrate the relationship between the function and its derivative. Add text labels with LaTeX formulas for the function and derivative expressions, and include auxiliary lines related to symmetry or reflection to help understand how the derivative changes with x. Keep the layout clear, emphasizing the geometric link between the graph and slope evolution.
The prompt above was compiled from the original drawing commands and is for reference only.