
Rolle’s Theorem Visual Construction and Tangent Point
Loading the math board and drawing, please wait…
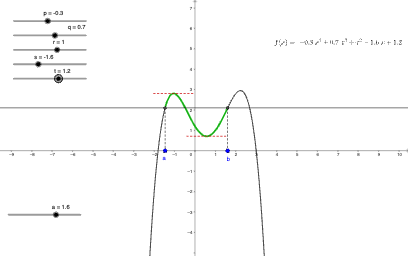
This GeoGebra example demonstrates Rolle’s Theorem by constructing a differentiable function on an interval where the endpoint values are equal. Visually, it highlights that at least one interior point exists where the derivative equals zero—equivalently, where the graph has a horizontal tangent. The key mathematical ideas are Rolle’s Theorem (existence of a stationary point given equal endpoint values and differentiability), the interpretation of f′(x)=0 as zero slope of the tangent, and the use of geometric constraints to locate the tangent/critical point. In the construction, it uses commands such as Line (straight lines), Intersect (intersection points), Roots (finding roots/zero-value positions), Tangent (tangent lines), Circle (auxiliary geometric constraints/objects), Segment (segments), along with Min/Max for extrema and labeled objects for the critical points and intermediate intersections (e.g., f, tangent-related points like t, and markers such as h/h′, l/m, and multiple intersection/parameter points). Suitable for upper-secondary enrichment, first-year calculus instruction, and classroom demonstrations of derivative concepts and theorem verification.
GeoGebra Commands & Parameters
Line(B, xAxis) → gIntersect(f, g, 1) → AMin(l1) → mnMax(l1) → mxRoots(h') → C, D, ETangent(F, h) → iTangent(G, h) → jTangent(H, h) → kCircle(G, 1) → q_{1}Intersect(k, xAxis) → NCircle(F, rd) → p_{1}Circle(G, rd) → s_{1}Circle(H, rd) → t_{1}Intersect(p_{1}, i) → I, JIntersect(s_{1}, j) → K, LIntersect(t_{1}, k) → M, OIntersect(j, k) → PIntersect(k, i) → QSegment(I, J) → lSegment(K, L) → mSegment(M, O) → nSegment(A, R) → bSegment(B, S) → c
AI Drawing Prompt Reference
Draw a differentiable function curve on a closed interval with equal endpoint values. Construct a horizontal line intersecting the curve at the endpoints. Identify the minimum and maximum points, and mark the roots of the derivative where the tangent is horizontal. At these critical points, draw tangent lines to the curve. Then create auxiliary circles centered at these points with equal radii, intersecting the tangents to form intersection points. Connect these intersection points with segments, and also connect the endpoints to two external auxiliary points, forming a complete geometric diagram that illustrates Rolle's theorem with at least one horizontal tangent.
The prompt above was compiled from the original drawing commands and is for reference only.