
Geometric Visualization of the Mean Value Theorem
Loading the math board and drawing, please wait…
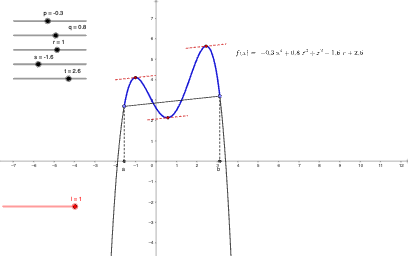
This example demonstrates how, on a function graph over an interval, one can identify a point where the tangent line’s slope matches the secant slope determined by the two endpoints—giving an intuitive geometric picture of the Mean Value Theorem. Key concepts include continuity and differentiability, the geometric meaning of the derivative as slope, secant versus tangent slopes, and the existence claim ensured by the theorem. Construction in GeoGebra uses Point and Segment to create key points and interval endpoints; Min and Max to set the relevant parameter/range; Slope and Intersect to compute and locate where slope correspondence occurs; Tangent to draw the tangent at the identified point; and Circle to build supporting geometric relationships as needed. Objects such as p, q, r, s, t, f, and additional constructed items (e.g., A, B, g, mn, mx, h, m, h', etc.) support the visualization that “there exists a point” where the two slope values coincide. Suitable for late high school and early university calculus instruction, as well as visual learning of derivatives and the Mean Value Theorem.
GeoGebra Commands & Parameters
Point(f) → APoint(f) → BSegment(A, B) → gMin(x(A), x(B)) → mnMax(x(A), x(B)) → mxSlope(g) → mIntersect(j, h', (-1.0164885594552617, 0.10716339816478984)) → CIntersect(j, h', (2.4437876314305114, 0.10716339816478984)) → DIntersect(h', j, (0.5727009284379095, 0.1071633981648692)) → ETangent(F, h) → iTangent(H, h) → kTangent(G, h) → l_{1}Circle(F, l) → cCircle(G, l) → dCircle(H, l) → eIntersect(c, i, 1) → IIntersect(c, i, 2) → JIntersect(d, l_{1}, 1) → KIntersect(d, l_{1}, 2) → LIntersect(e, k, 1) → MIntersect(e, k, 2) → NSegment(I, J) → nSegment(K, L) → aSegment(M, N) → bSegment(A, O) → f_1Segment(B, P) → g_1
AI Drawing Prompt Reference
Draw a function graph over an interval to illustrate the Mean Value Theorem. Identify a point where the slope of the tangent line equals the slope of the secant line determined by the endpoints. Key objects include function points, interval endpoints, secant line, tangent line, and auxiliary circles. The construction order involves determining endpoints and drawing the secant line, calculating the secant slope, locating the point with matching slopes, drawing the tangent line, and adding auxiliary circles to show geometric relationships.
The prompt above was compiled from the original drawing commands and is for reference only.