
Area Between Two Curves Rotated about the Y-Axis
Loading the math board and drawing, please wait…
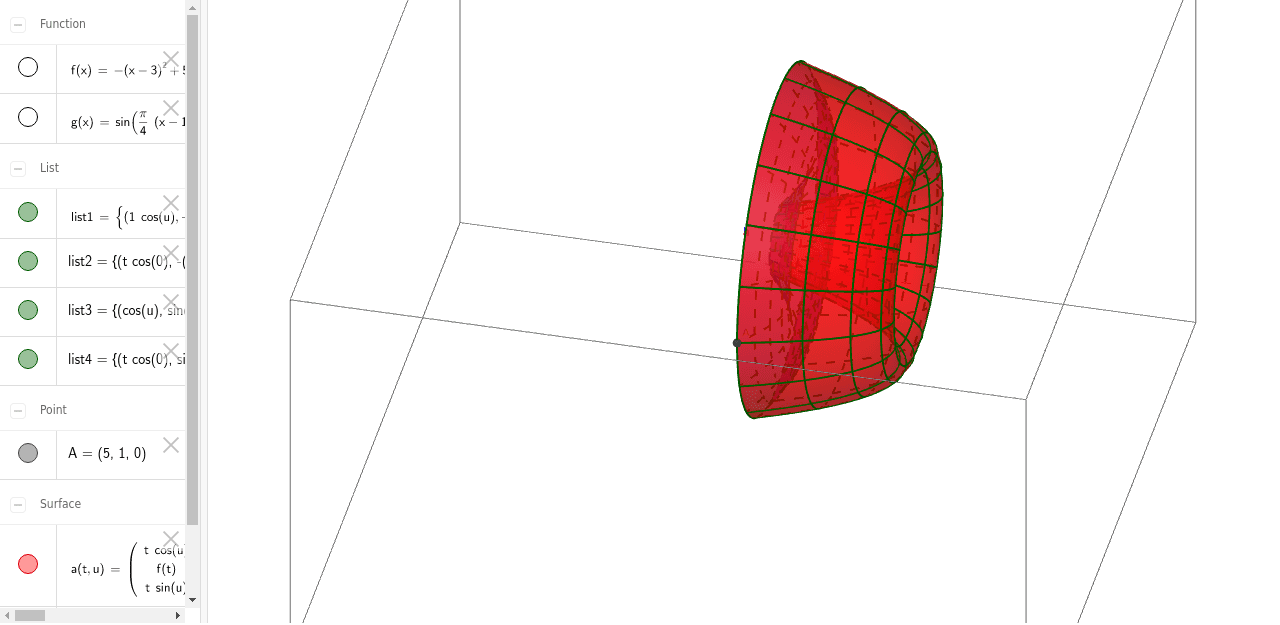
This example demonstrates the volume of the solid formed by rotating the area between two curves about the y-axis. It involves the concept of integration, and through commands like Intersect, Surface, and Sequence, it visually illustrates the formation of the solid. Suitable for high school and above students learning about the volume of solids of revolution in calculus.
GeoGebra Commands & Parameters
Intersect(g, f, (4.999999999874703, 1.0000000000984082)) → ASurface((t * cos(u)), f(t), (t * sin(u)), t, 1, 5, u, 0, 6.283185307179586) → aSurface((t * cos(u)), g(t), (t * sin(u)), t, 1, 5, u, 0, 6.283185307179586) → bSequence(CurveCartesian[(t * cos(u)), f(t), (t * sin(u)), u, 0, 6.283185307179586], t, 1, 5, 0.5) → list1Sequence(CurveCartesian[(t * cos(u)), f(t), (t * sin(u)), t, 1, 5], u, 0, 6.283185307179586, 0.3490658503988659) → list2Sequence(CurveCartesian[(t * cos(u)), g(t), (t * sin(u)), u, 0, 6.28319], t, 1, 5, 0.5) → list3Sequence(CurveCartesian[(t * cos(u)), g(t), (t * sin(u)), t, 1, 5], u, 0, 6.28319, 0.34907) → list4
AI Drawing Prompt Reference
Draw two function curves, f(x) and g(x), intersecting near the point (5,1). Shade the region bounded by these curves from x=1 to x=5. Then revolve this area around the y‑axis to form a hollow solid, illustrating the volume of the solid of revolution. The outer surface corresponds to the rotation of the upper curve, while the inner surface comes from the lower curve. Include the intersection point and the limits of rotation to clearly show how the volume is generated.
The prompt above was compiled from the original drawing commands and is for reference only.